Page History
...
| Numbered figure captions | ||||
|---|---|---|---|---|
| ||||
|
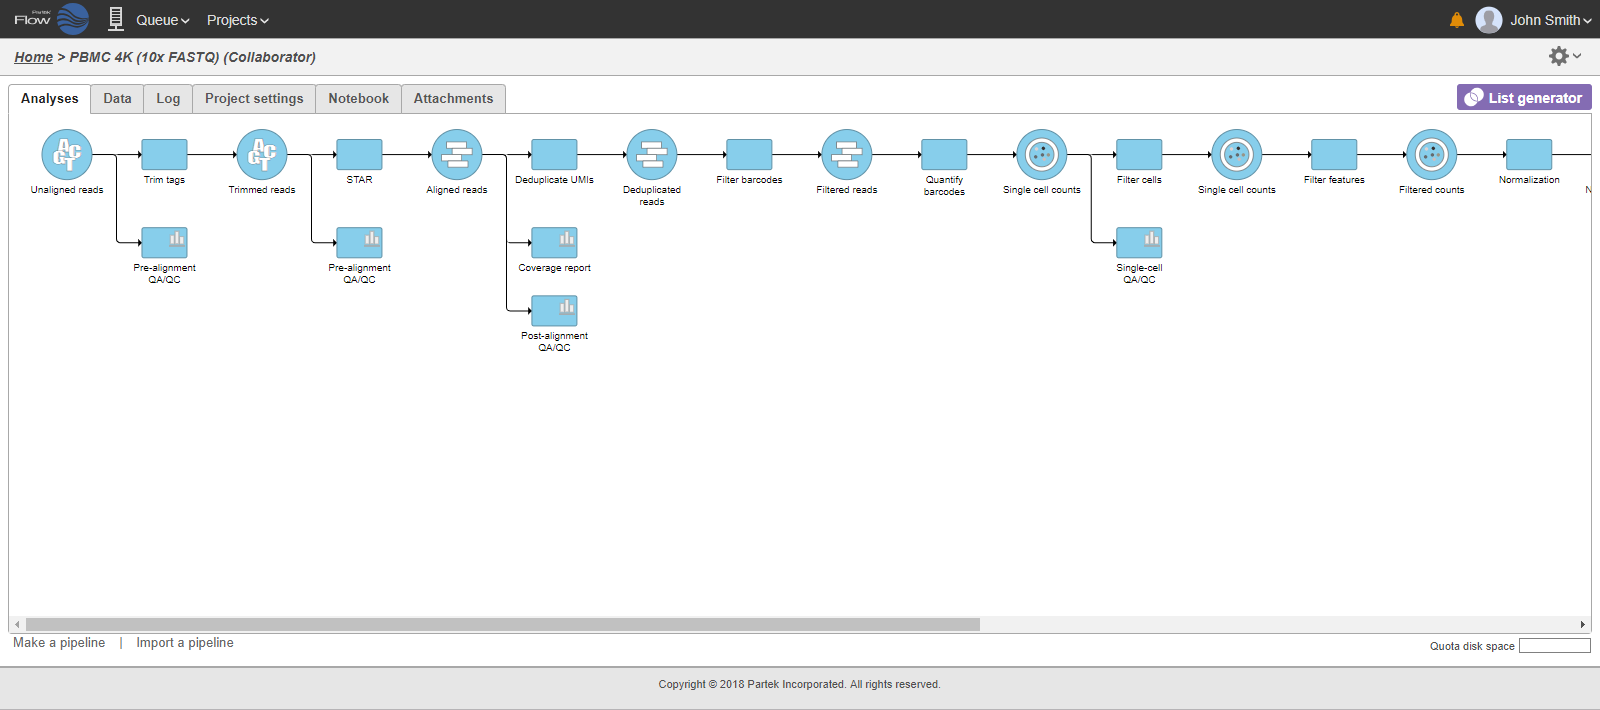
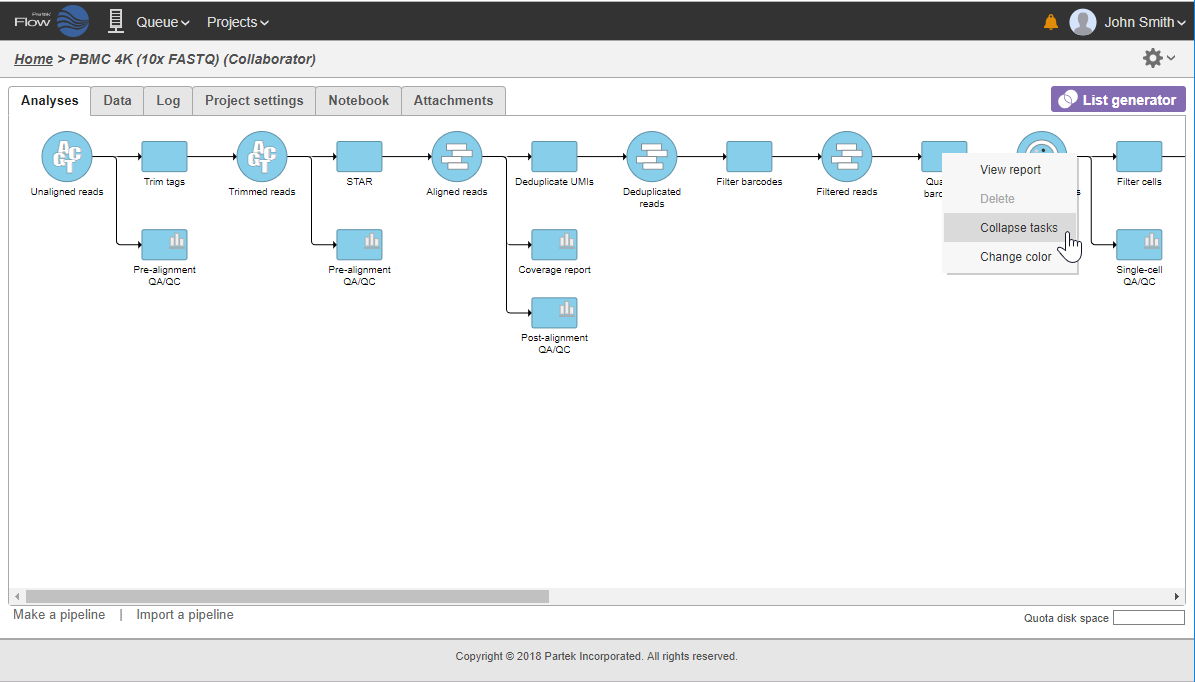
In that case, the pipeline can be collapsed, to hide the steps that are (no longer) relevant. For example, once the single-cell RNA-seq data has been quantified, Single cell counts data node will be a new analysis start point, as the subsequent analyses will not focus on alignment, UMI deduplication etc. To start, right-click on the task node which should become a boundary of the collapsed portion of your pipeline and select Collapse tasks (Figure 19).
| Numbered figure captions | ||||
|---|---|---|---|---|
| ||||
|
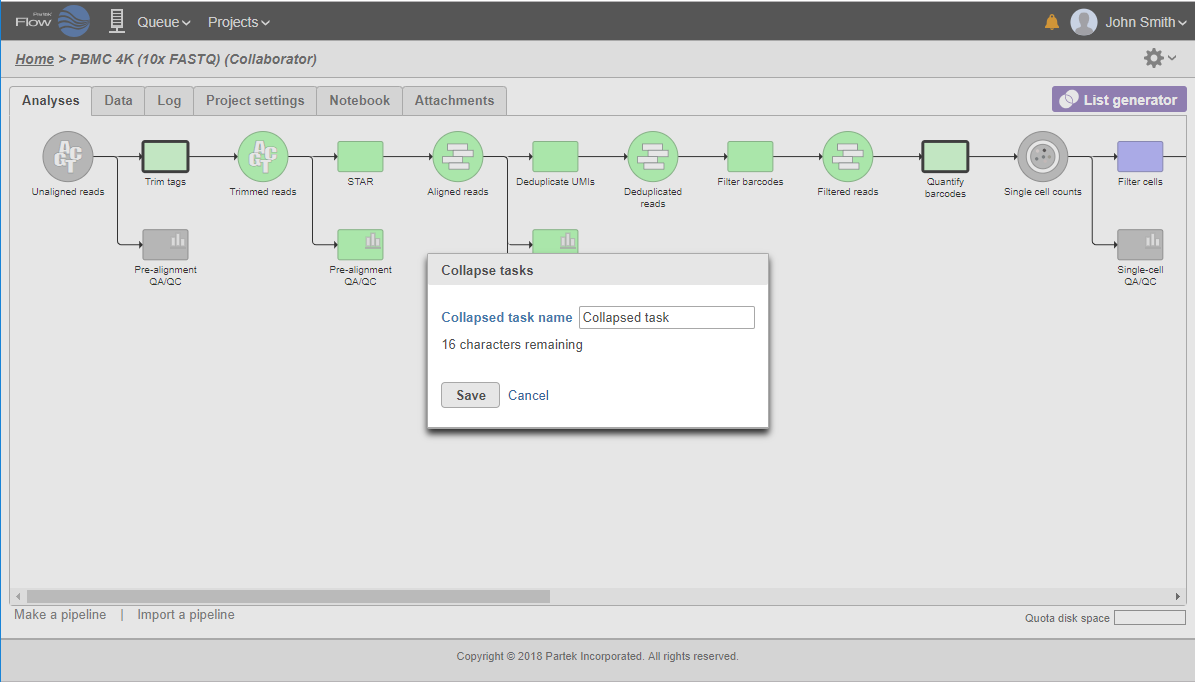
All the tasks on that layer will turn purple. Then left-click the task which should be the other boundary of the collapsed portion. All the tasks that will be collapsed will turn green and a dialog will appear (Figure 19). In the example shown in Figure 19, the tasks between Trim tags and Quantify barcodes will be collapsed. Give the collapsed section a name (up to 30 characters) and select Save (Figure 20).
| Numbered figure captions | ||||
|---|---|---|---|---|
| ||||
|
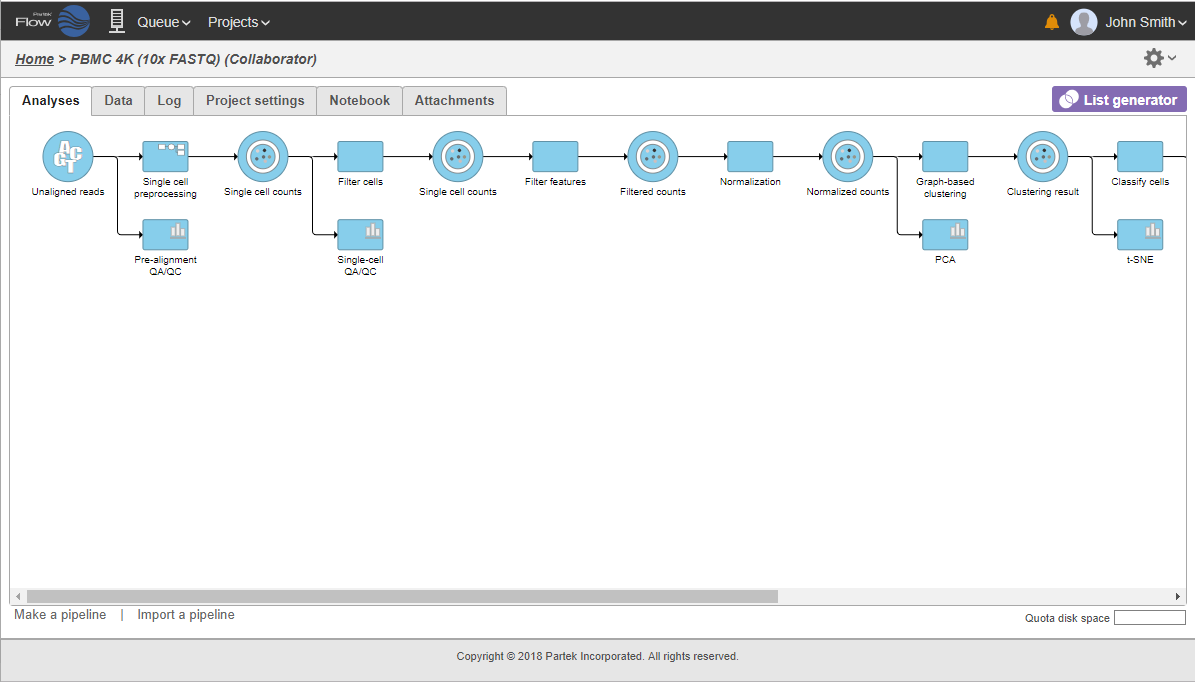
The collapsed portion of the pipeline is replaced by single task node, with a custom label ("Single cell preprocessing"; Figure 21).
...
To re-expand the pipeline double click on the task node representing the collapsed portion of the pipeline. Alternatively, single click on the node and select Expand... on the context-sensitive menu
| Numbered figure captions | ||||
|---|---|---|---|---|
| ||||
|
...
| Numbered figure captions | ||||
|---|---|---|---|---|
| ||||
|

Downloading Data
...
Overview
Content Tools