Page History
...
The UMI counts per cell and number of detected genes per cell are typically used to filter out potential doublets - if a cell as an unusually high number of total UMIs or detected genes, it may be a doublet. The mitochondrial counts percentage can be used to identify cells damaged during cell isolation - if a cell has a high percentage of mitochondrial counts, it is likely damaged or dying and may need to be excluded.
- Set the filters to a maximum of 12000 Read counts, 2500 Detected genes, and 8% Mitochondrial reads
- Click Apply filter to run the Filter cells task
Normalization
Because different cells will have a different number of total UMIs, it is important to normalize the data prior to downstream analysis. For droplet-based single cell isolation and library preparation methods that use a 3' counting strategy, where only the 3' end of each transcript is captured and sequenced, we recommend the following normalization - 1. CPM (counts per million), 2. Add 1, 3. Log2. This accounts for differences in total UMI counts per cell and log transforms the data, which makes the data easier to visualize.
...
- Click Summary to open the summary table (Figure 2627)
| Numbered figure captions | ||||
|---|---|---|---|---|
| ||||
|
...
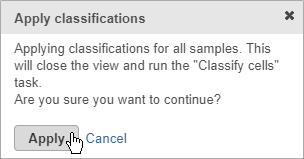
- Click Apply classifications
- Click Apply to confirm (Figure 2728)
| Numbered figure captions | ||||
|---|---|---|---|---|
| ||||
|
...
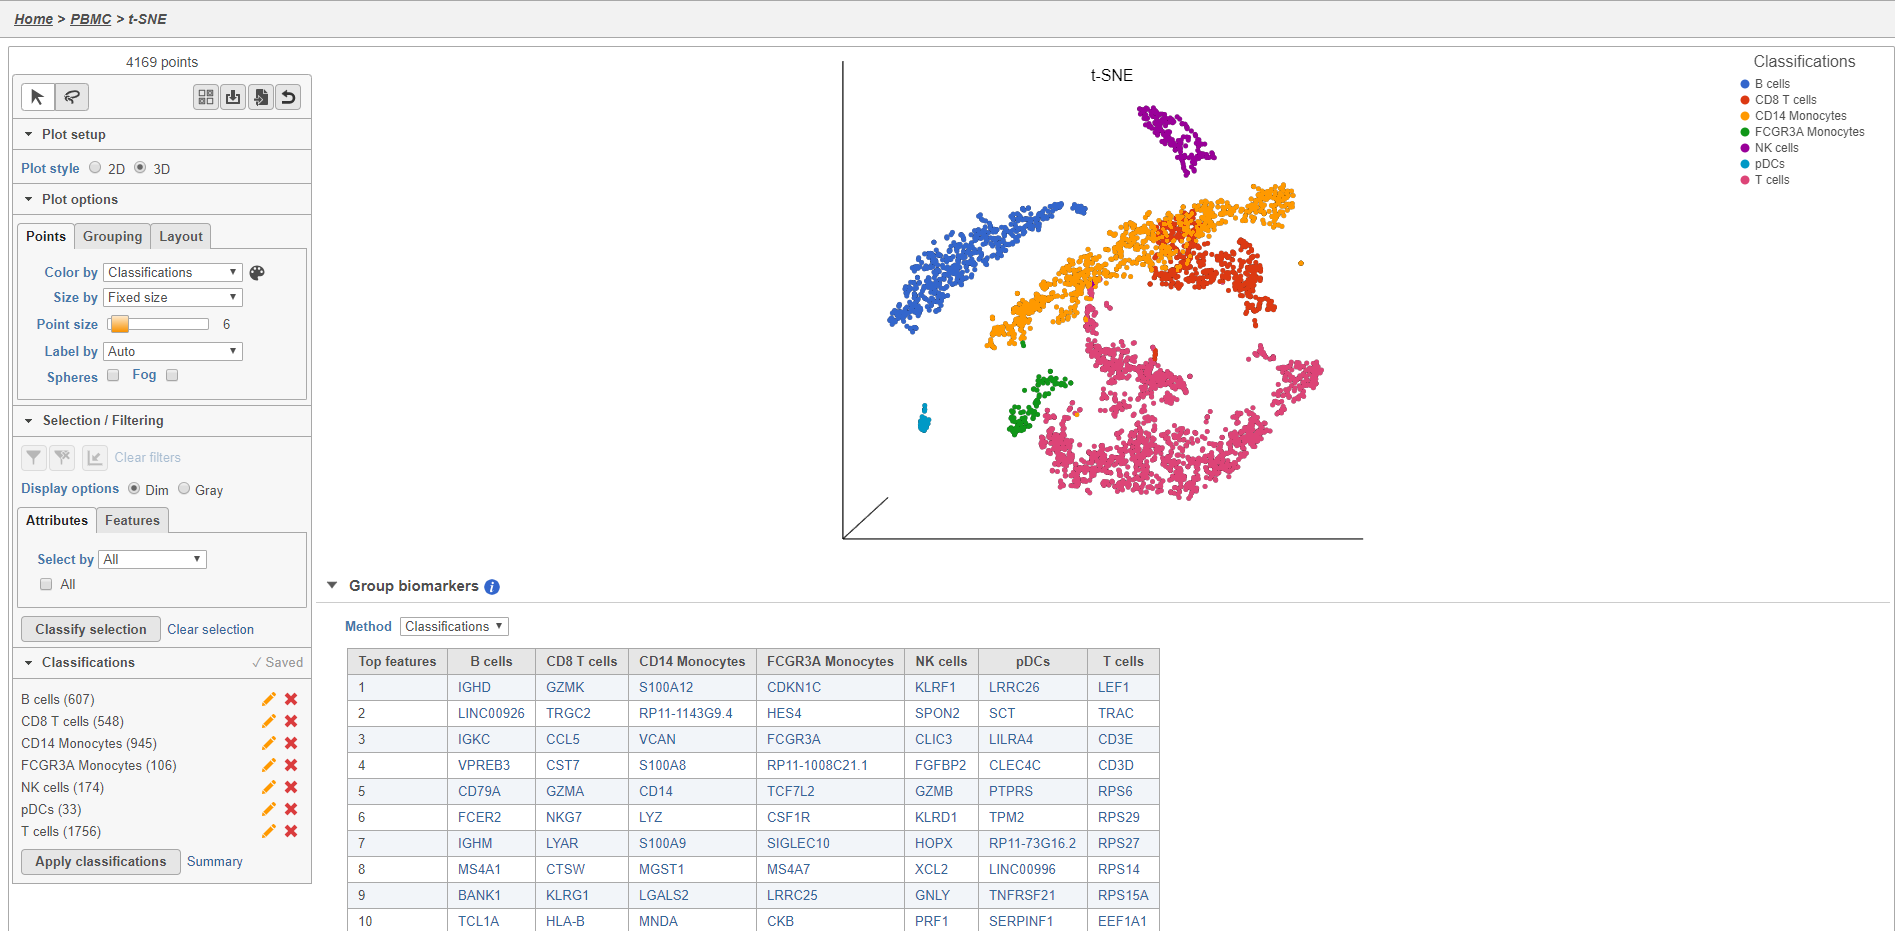
The Classified groups task report opens a t-SNE like the one used to classify the cells, but the newly calculated classifications biomarker table is available below the plot (Figure 28)29.
| Numbered figure captions | ||||
|---|---|---|---|---|
| ||||
|
...
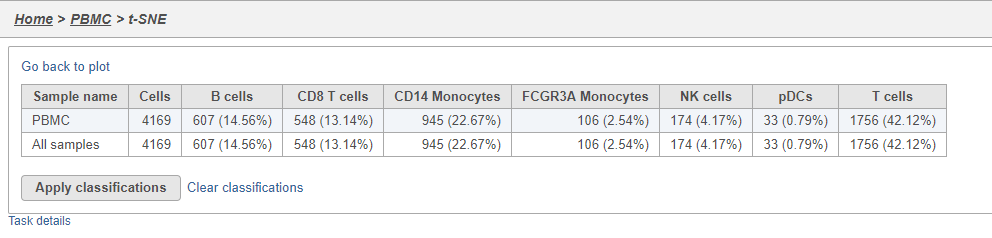
The number of cells for each sample is listed (Figure 2930). This data node can be used as the starting point for differential cell count analysis in multi-sample experiments where the number of cells of a particular cell type if two or more conditions is of interest.
...
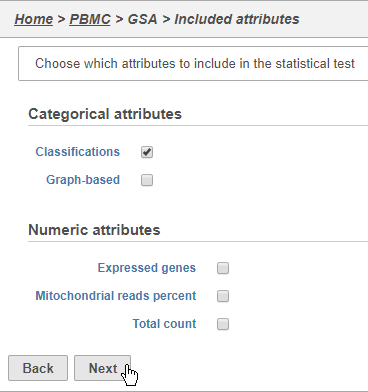
- Click Classifications
- Click Next (Figure 3031)
| Numbered figure captions | ||||
|---|---|---|---|---|
| ||||
|
...
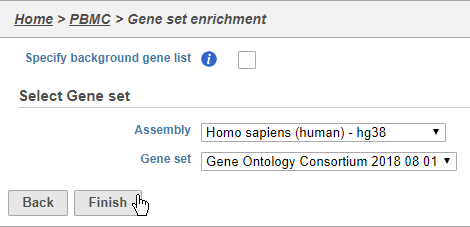
- Choose Homo sapiens (human) - hg38 from the Assembly drop-down
- Choose Gene Ontology Consortium 2018 08 01 from the Gene set drop-down
- Click Finish (Figure 38)
| Numbered figure captions | ||||
|---|---|---|---|---|
| ||||
|
...
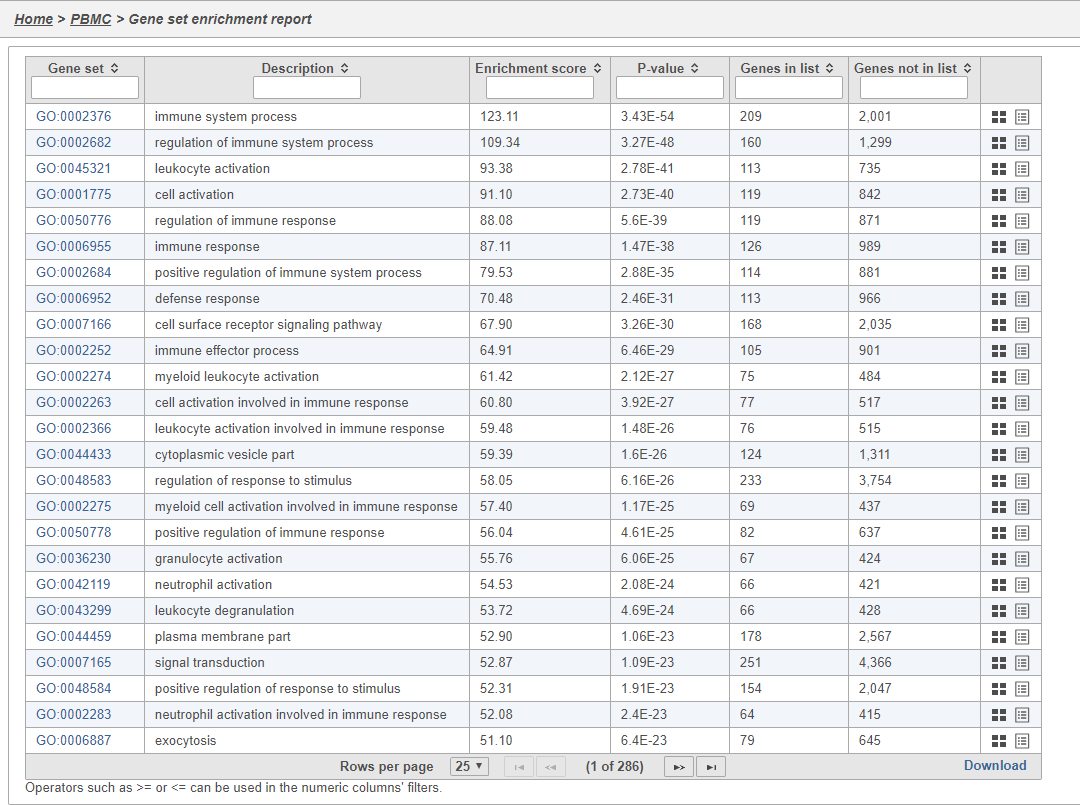
The Gene set enrichment task report lists gene sets on rows with an enrichment score and p-value for each. It also lists how many genes in the gene set were in the input gene list and how many were not (Figure 38). Clicking the Gene set ID links to the geneontology.org page for the gene set.
| Numbered figure captions | ||||
|---|---|---|---|---|
| ||||
|
...
Overview
Content Tools