Page History
...
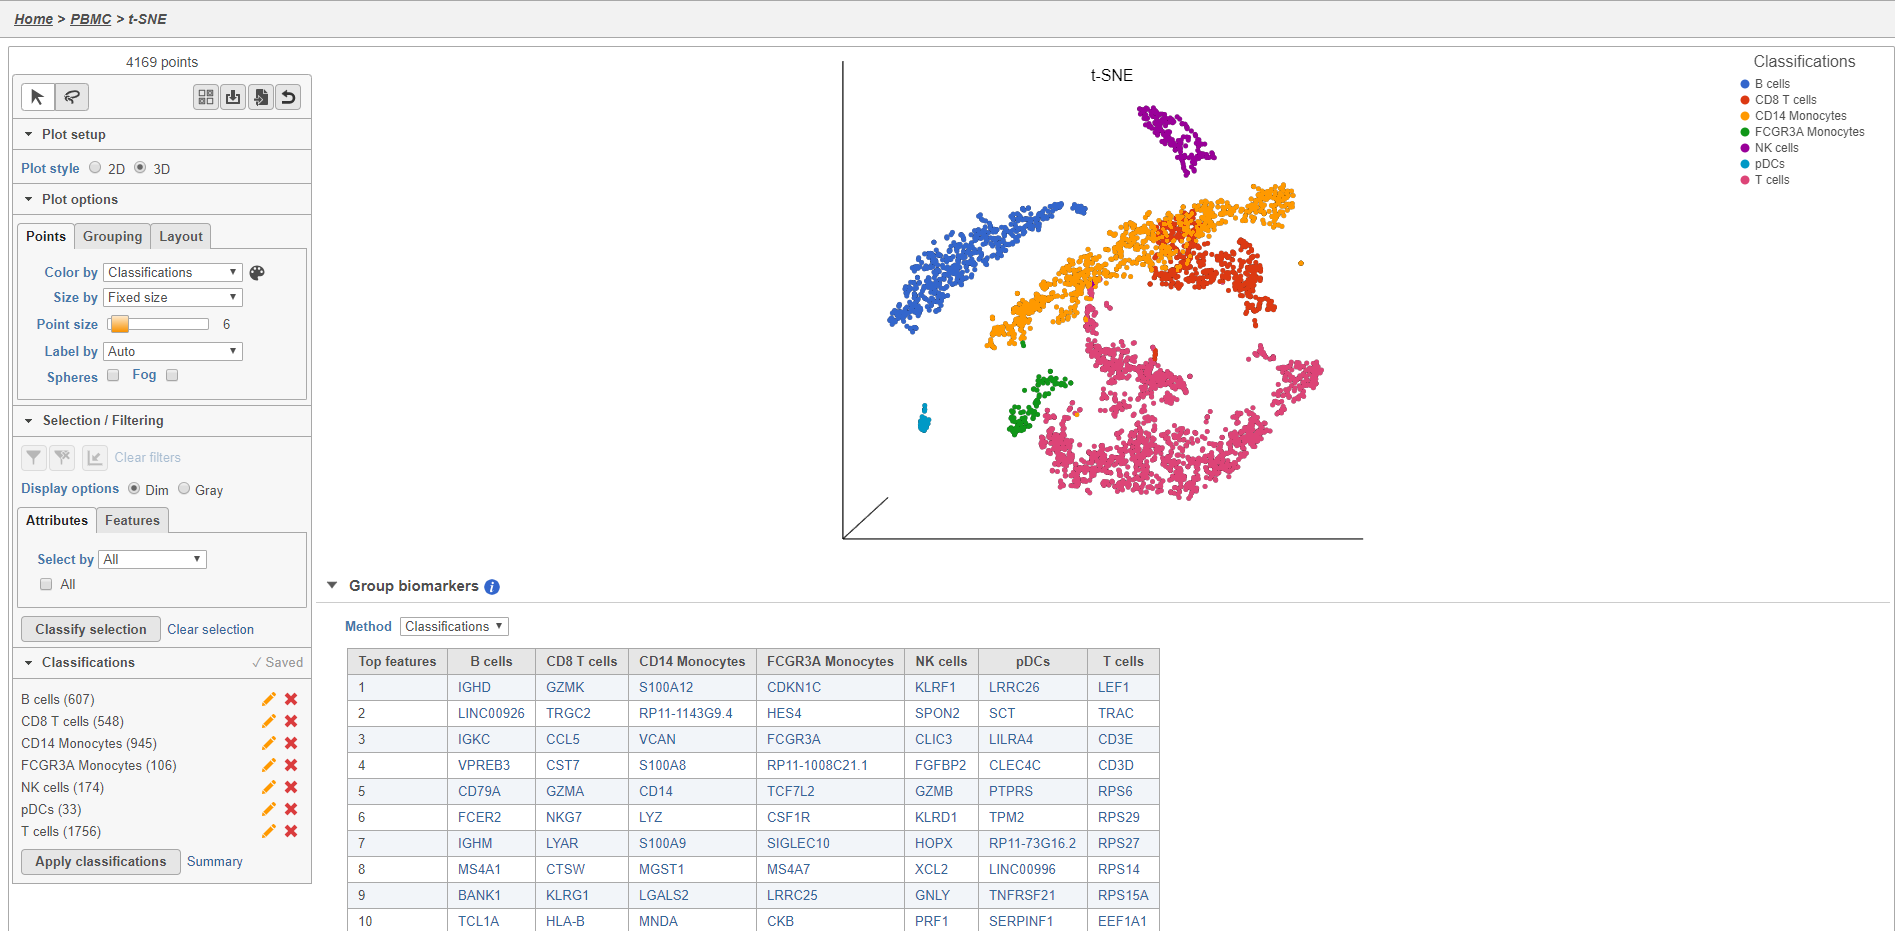
The Classified groups task report opens a t-SNE like the one used to classify the cells, but the newly calculated classifications biomarker table is available below the plot (Figure 28).
| Numbered figure captions | ||||
|---|---|---|---|---|
| ||||
|
...
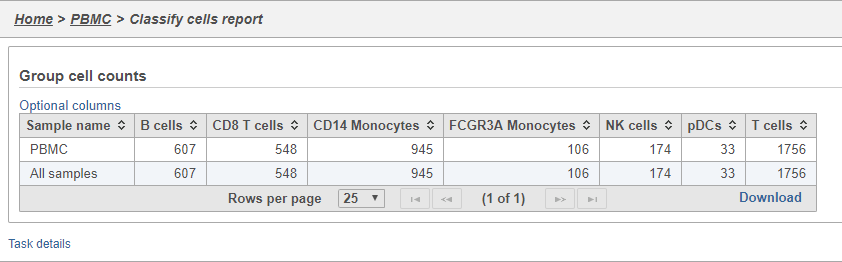
The number of cells for each sample is listed (Figure 29). This data node can be used as the starting point for differential cell count analysis in multi-sample experiments where the number of cells of a particular cell type if two or more conditions is of interest.
| Numbered figure captions | ||||
|---|---|---|---|---|
| ||||
|
Comparing gene expression between cell types
...
Overview
Content Tools