Page History
...
- Double-click the t-SNE task node to open the t-SNE task report (Figure 11)
| Numbered figure captions | ||||
|---|---|---|---|---|
| ||||
|
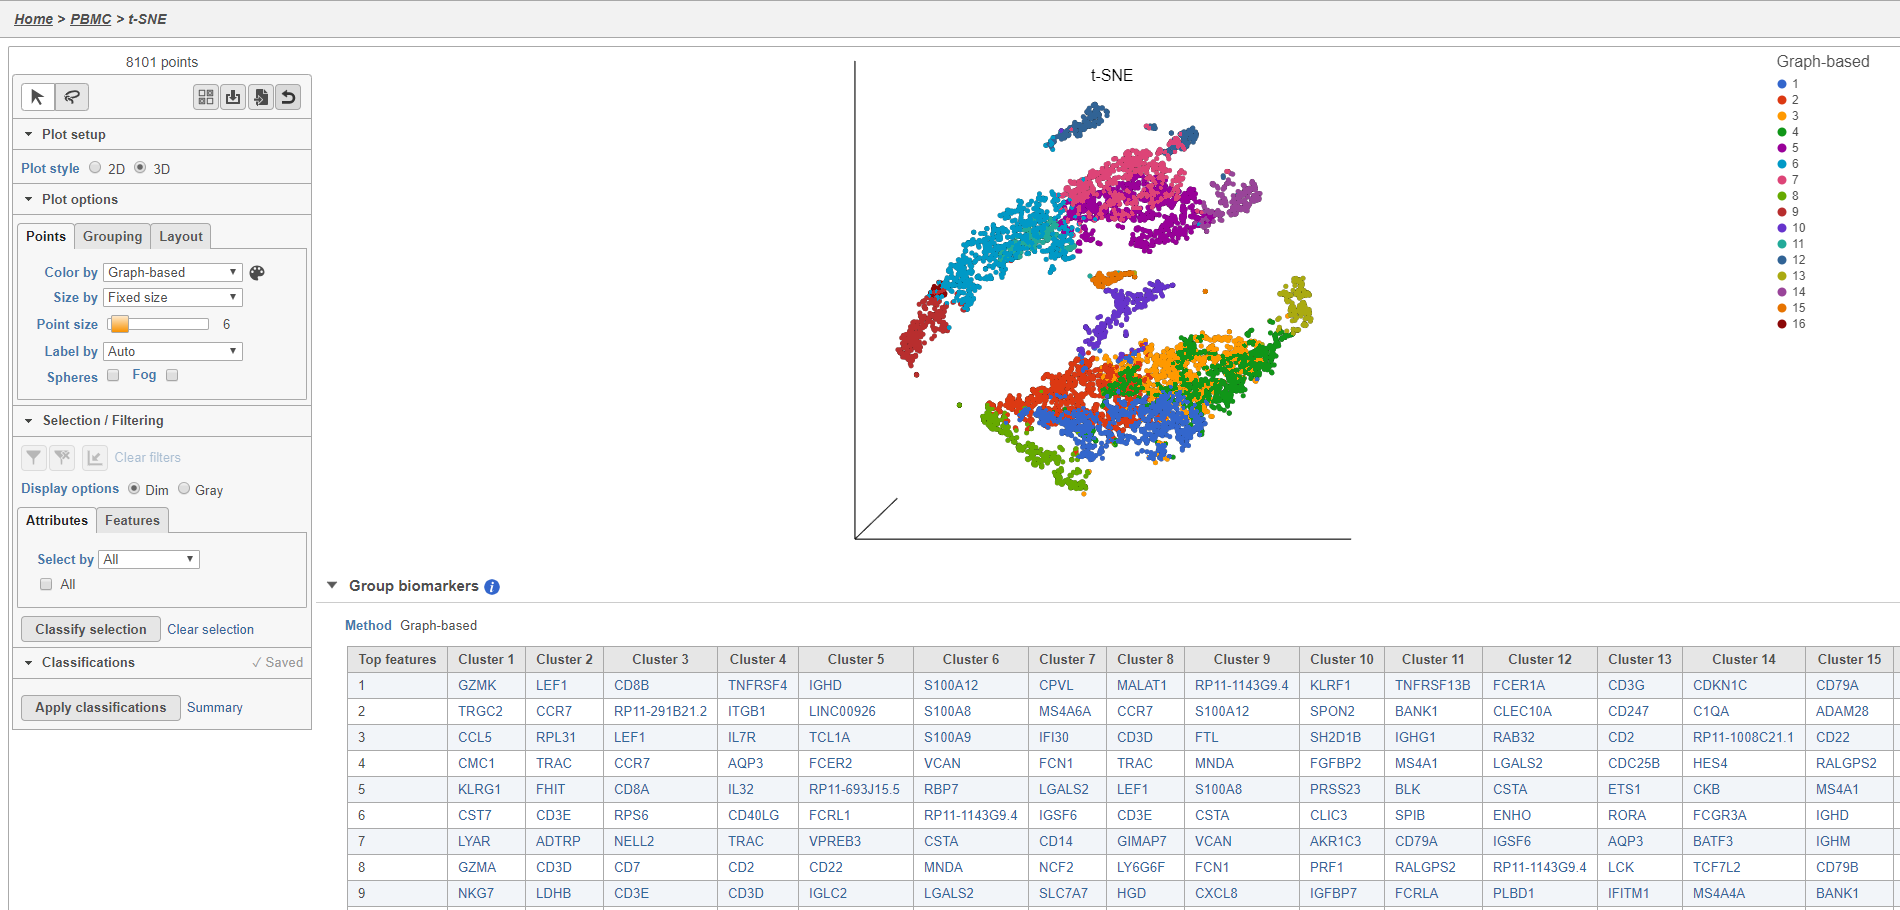
The t-SNE plot is in 3D by default. You can rotate the 3D plot by left-clicking and dragging your mouse. You can zoom in and out using your mouse wheel. You can pan by right-clicking and dragging your mouse. The 2D t-SNE is also calculated and you can switch between the 2D and 3D plots using the Plot style radio buttons.
By default, the t-SNE plot will be colored by the clusters identified by Graph-based clustering.
| Additional assistance |
|---|
|
| Rate Macro | ||
|---|---|---|
|
Overview
Content Tools