Page History
| Table of Contents | ||||||
|---|---|---|---|---|---|---|
|
...
- Click Configure to access the advanced options
- Set Number of principal components to 10 (Figure 8)
| Numbered figure captions | ||||
|---|---|---|---|---|
| ||||
|
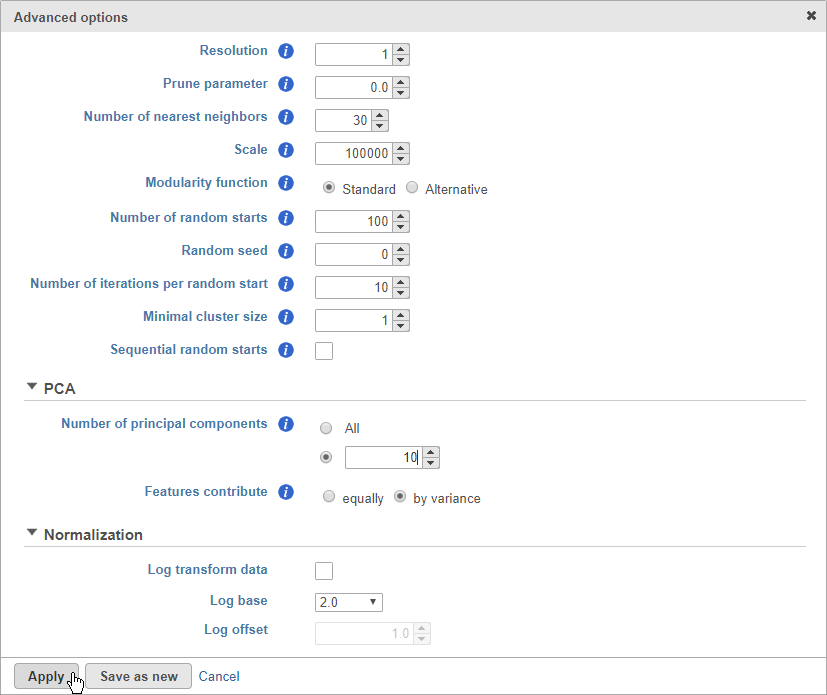
The Number of principal components should be set based on the your examination of the Scree plot and component loadings table. The default value of 100 is likely exhaustive for most data sets, but may introduce noise that reduces the resolution of clustering (fewer clusters identified).
...
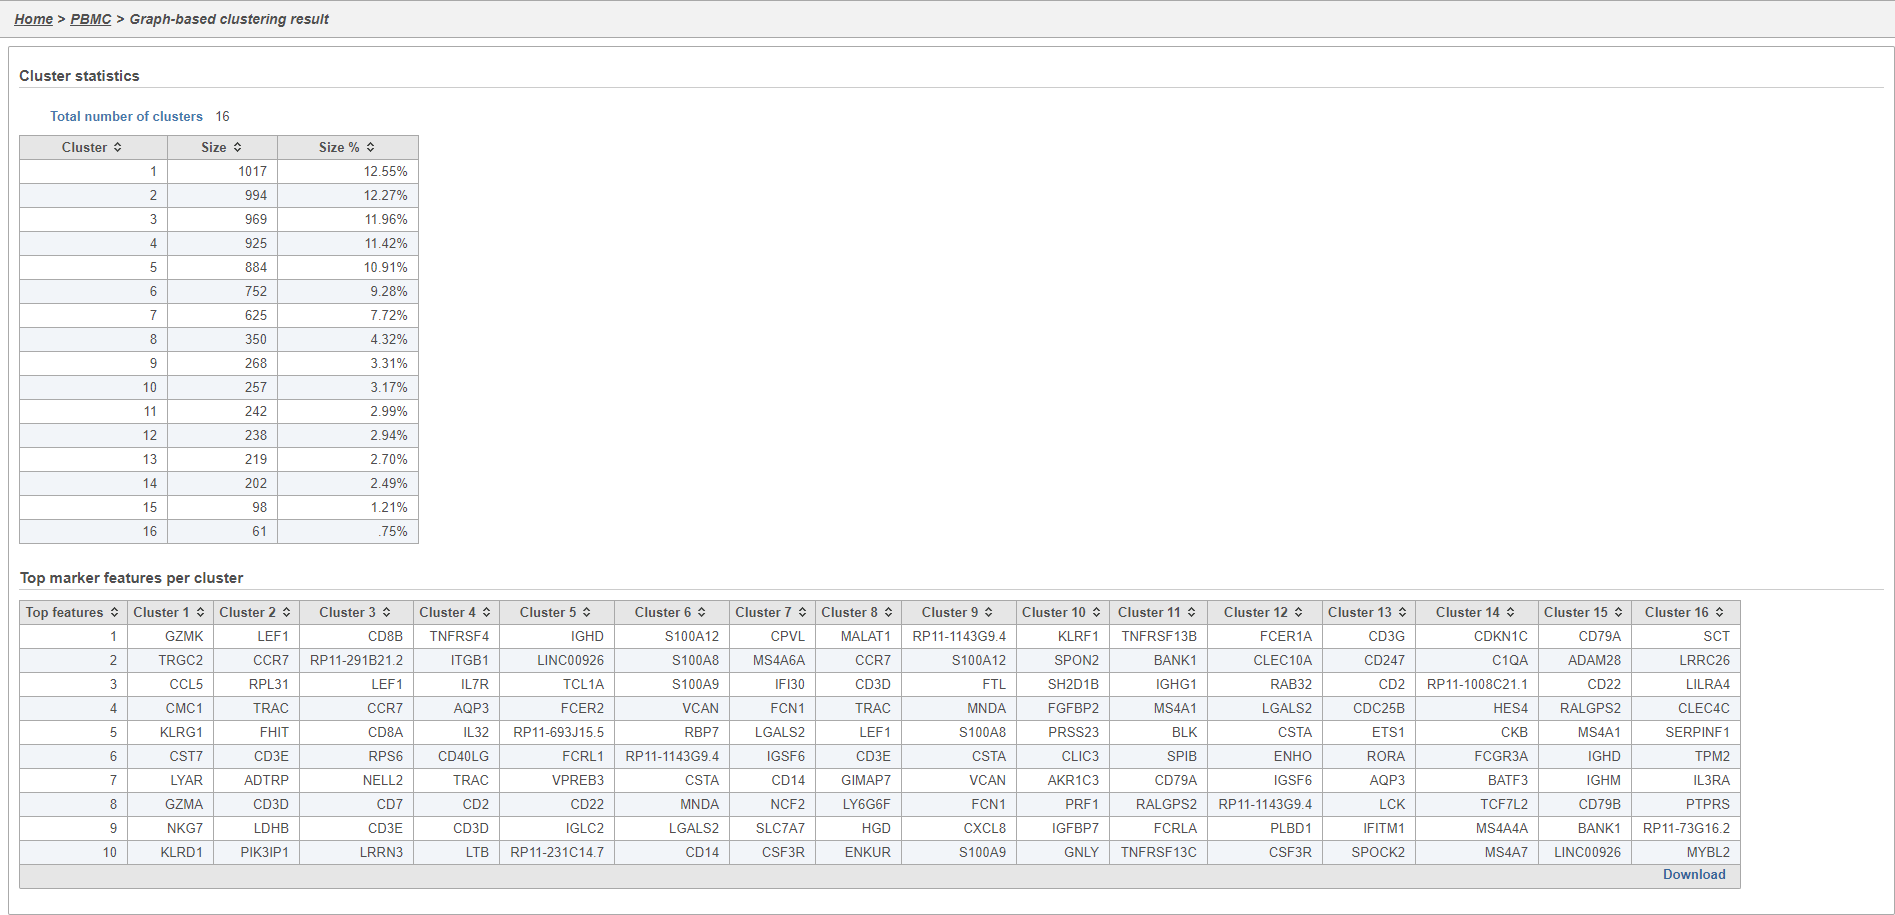
The Graph-based clustering task report lists the number of clusters and what proportion of cells fall into each cluster. It also includes a cluster biomarkers table. This lists the top-10 genes that distinguish each cluster from the others (Figure 9).
| Numbered figure captions | ||||
|---|---|---|---|---|
| ||||
|
...
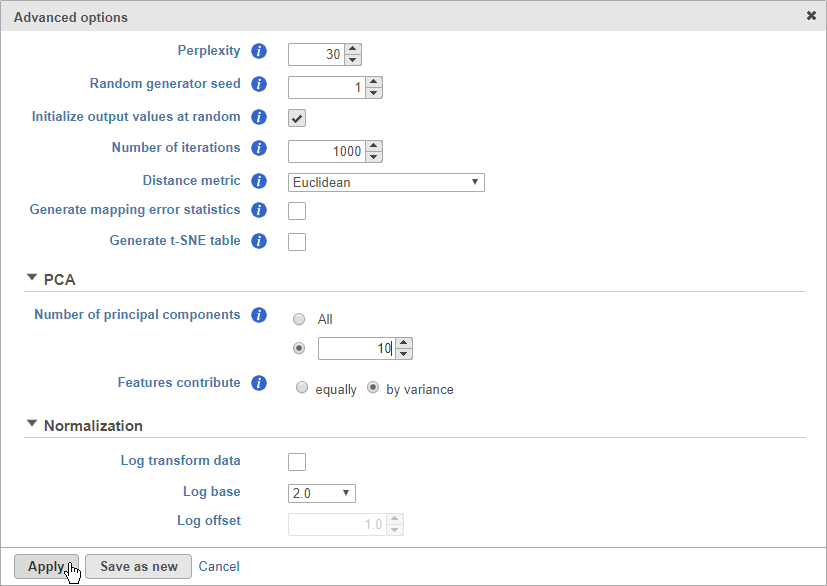
- Click Configure to access the advanced options
- Set Number of principal components to 10
- Click Apply
- Click Finish to run (Figure 10)
| Numbered figure captions | ||||
|---|---|---|---|---|
| ||||
|
...
Overview
Content Tools