Page History
...
- Click the Normalized counts node
- Click Exploratory analysis in the task menu
- Click PCA
You can choose Features contribute contribute equally to standardize the genes prior to PCA or allow more variable genes to have a larger effect on the PCA by choosing by variance. By default, we take variance into account and focus on the most variable genes.
...
- Click Configure to access the advanced settings
- Click Generate PC quality measures (Figure 5)
| Numbered figure captions | ||||
|---|---|---|---|---|
| ||||
|
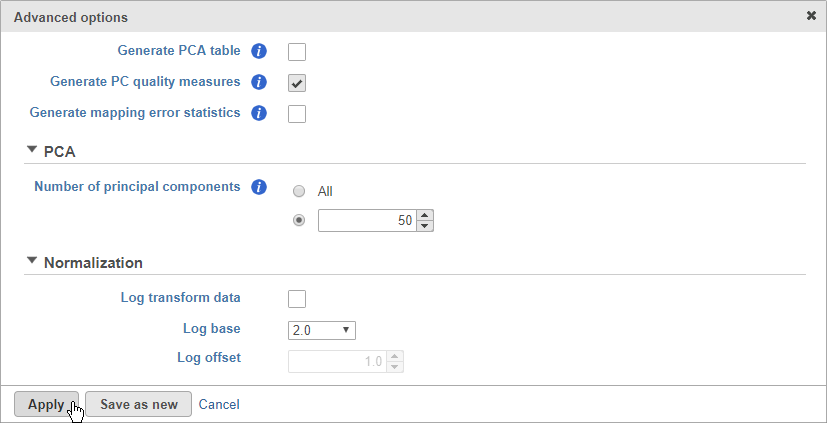
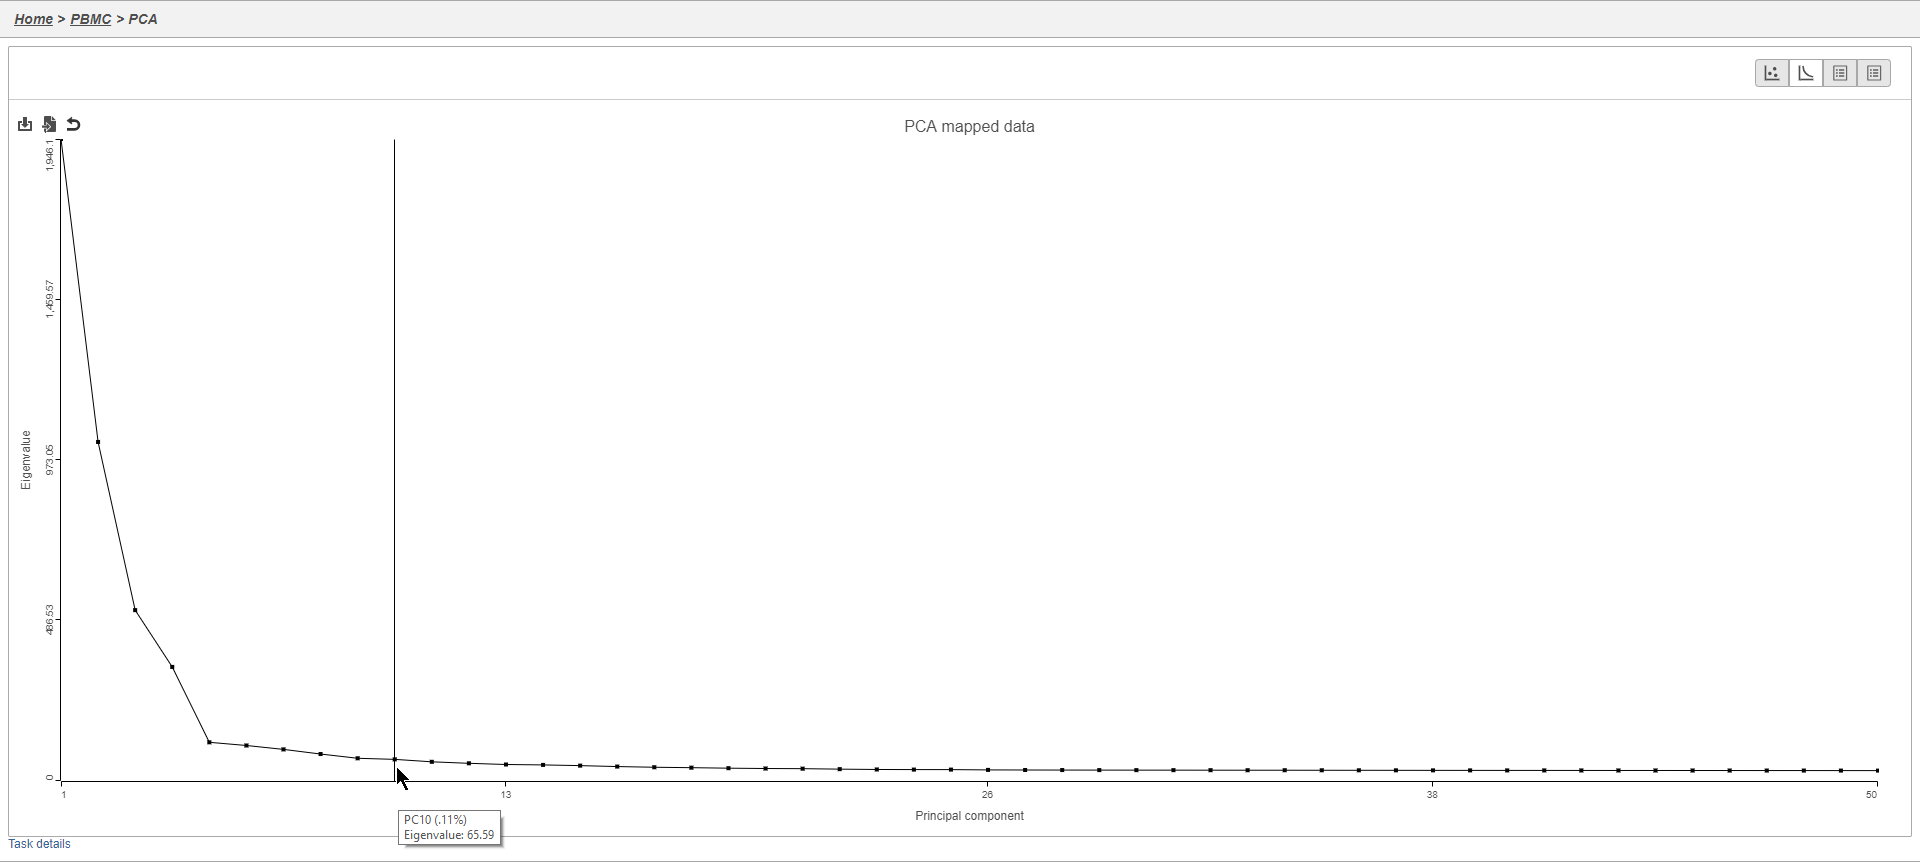
This will generate a Scree plot and PC component loadings table, which are useful for determining how many PCs to use for downstream analysis tasks.
...
- Mouse over the Scree plot to identify the point where additional PCs offer little additional information (Figure 6)
| Numbered figure captions | ||||
|---|---|---|---|---|
| ||||
|
...
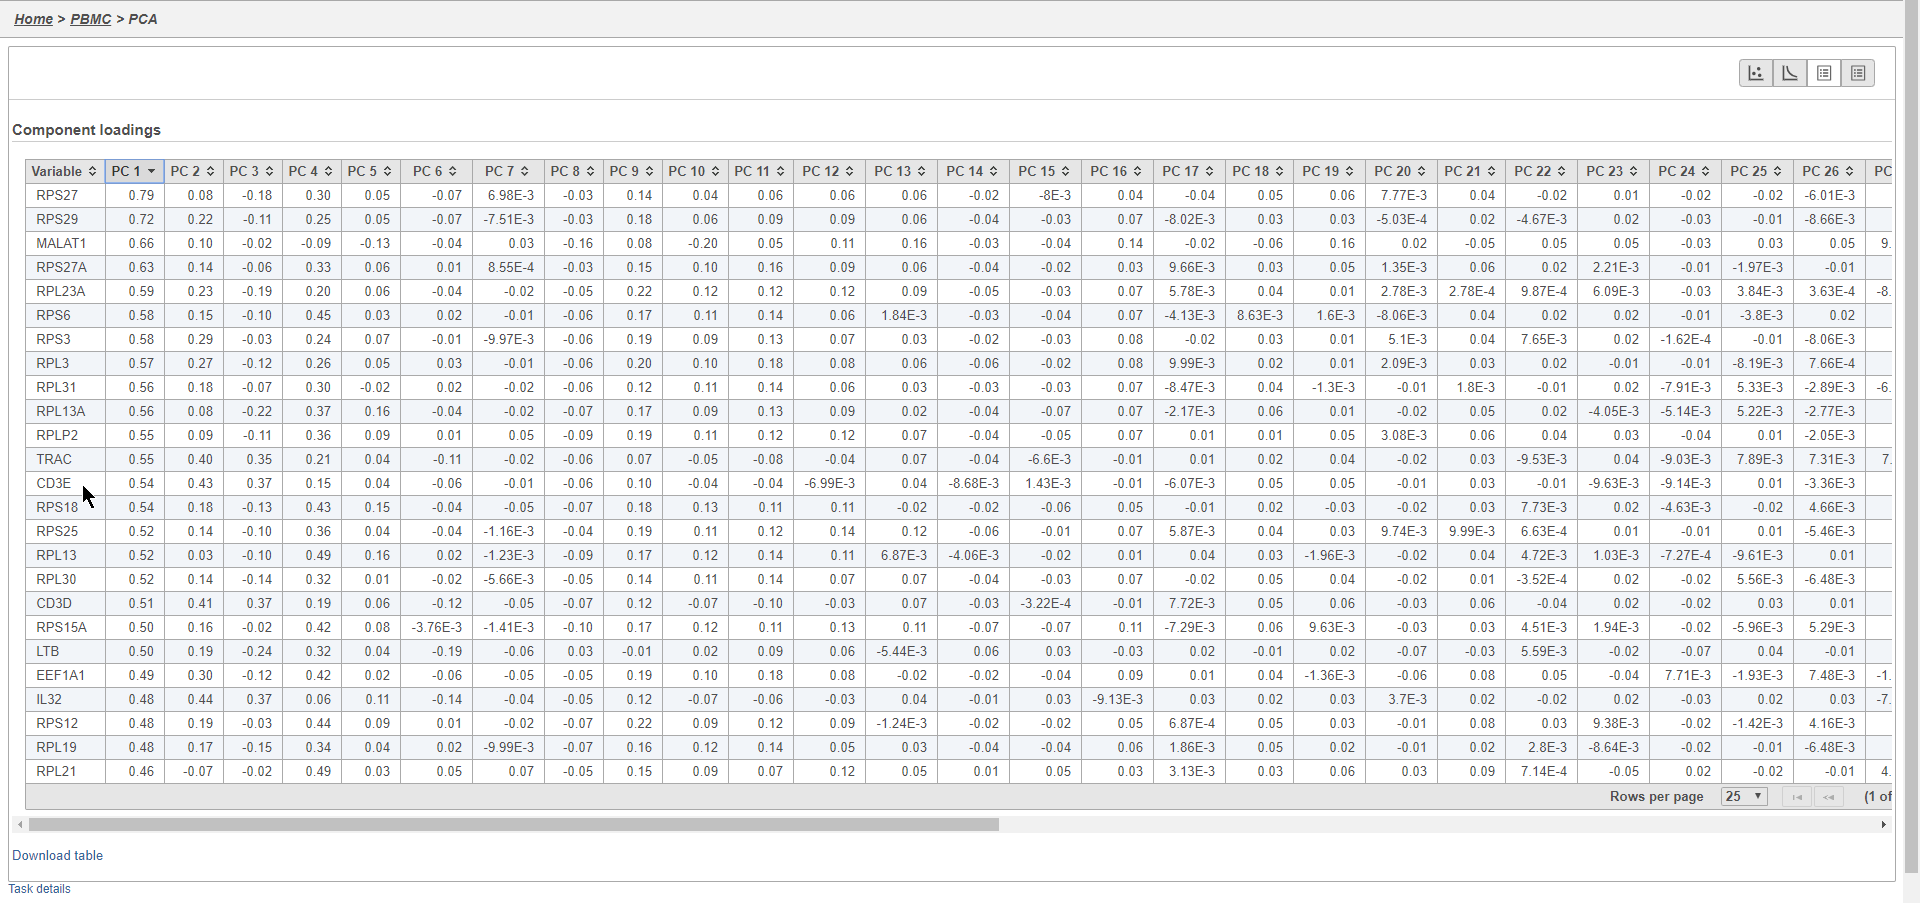
In this case, we see a few known marker genes are highly correlated with PC1 (Figure 7).
| Numbered figure captions | ||||
|---|---|---|---|---|
| ||||
|
Graph-based clustering
Graph-based clustering identifies groups of similar cells using PC values as the input. By including only the most informative PCs, noise in the data set is excluded, improving the results of clustering.
...
Overview
Content Tools