Page History
...
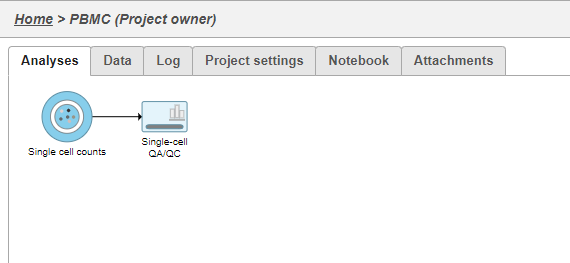
A task node, Single cell QA/QC, is produced. Initially, the node will be semi-transparent to indicate that it has been queued, but not completed. A progress bar will appear on the Single cell QA/QC task node to indicate that the task is running (Figure 1).
| Numbered figure captions | ||||
|---|---|---|---|---|
| ||||
|
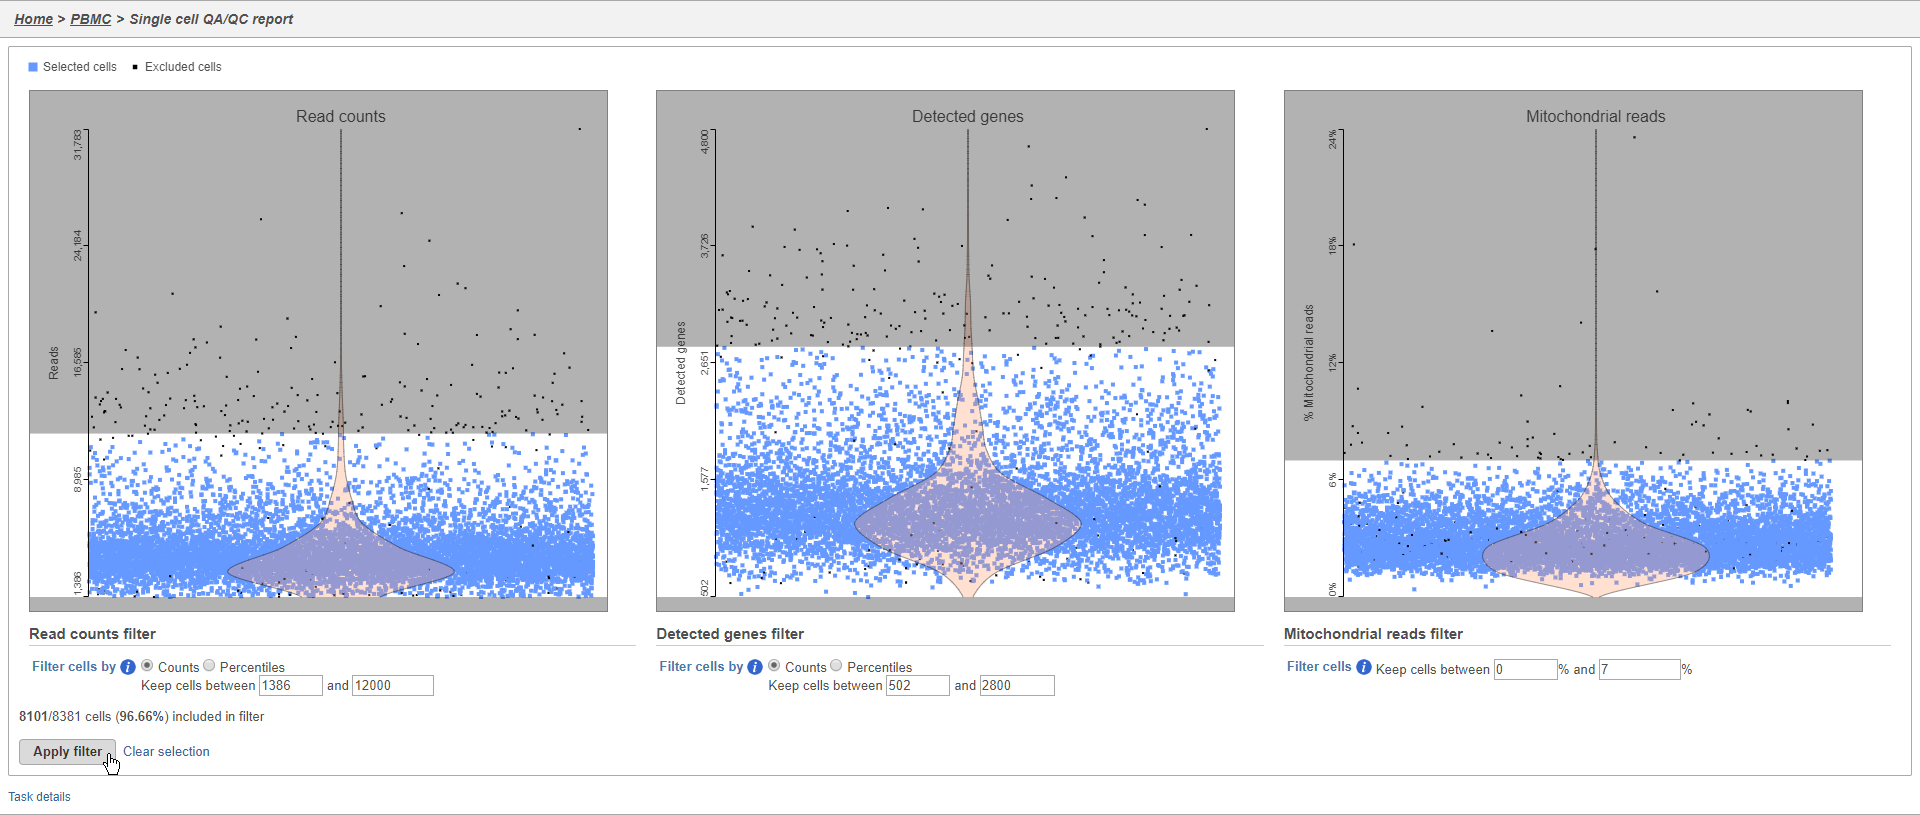
- Click the Single cell QA/QC node once it finishes running
- Click Task report in the task menu
The Single cell QA/QC report includes interactive violin plots showing the value of every cell in the project on several quality measures (Figure 12).
| Numbered figure captions | ||||
|---|---|---|---|---|
| ||||
|
...
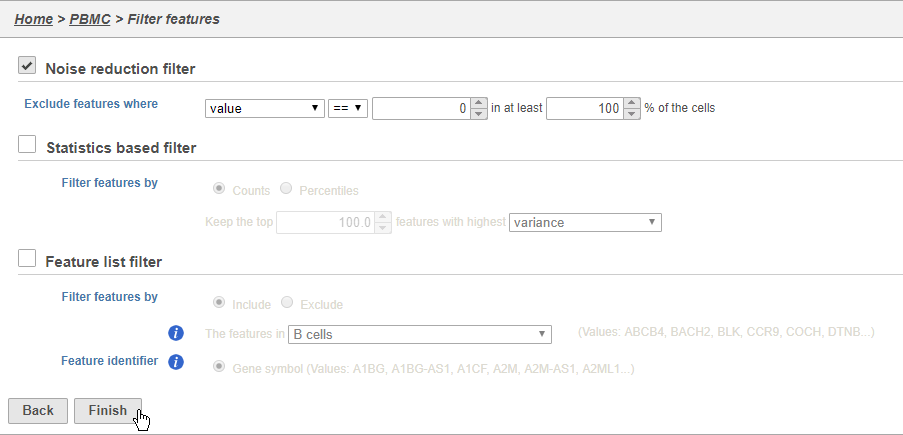
- Click the Noise reduction filter check box
- Set the Noise reduction filter to Exclude features where value == 0 in 100% of cells using the drop-down menus and text boxes
- Click Finish to apply the filter (Figure 3)
| Numbered figure captions | ||||
|---|---|---|---|---|
| ||||
|
This produces a Filtered counts data node. This will be the starting point for the next stage of analysis - identifying cell types in the data using the interactive t-SNE plot.
...
- Click Finish to apply the normalization (Figure 4)
| Numbered figure captions | ||||
|---|---|---|---|---|
| ||||
|
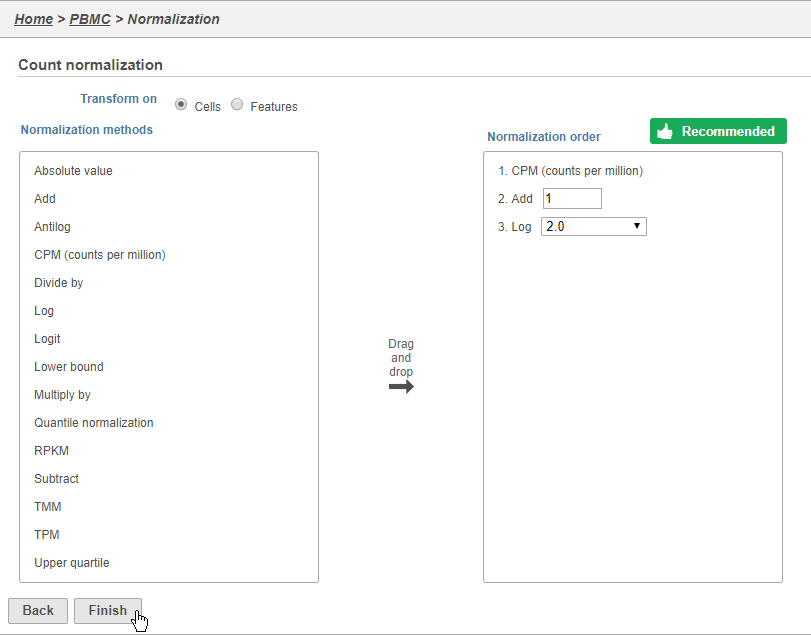
A new Normalized counts data node will be produced.
...
Overview
Content Tools