Page History
...
The Single cell QA/QC report includes interactive violin plots showing the value of every cell in the project on several quality measures (Figure 1).
There
| Numbered figure captions | ||||
|---|---|---|---|---|
| ||||
|
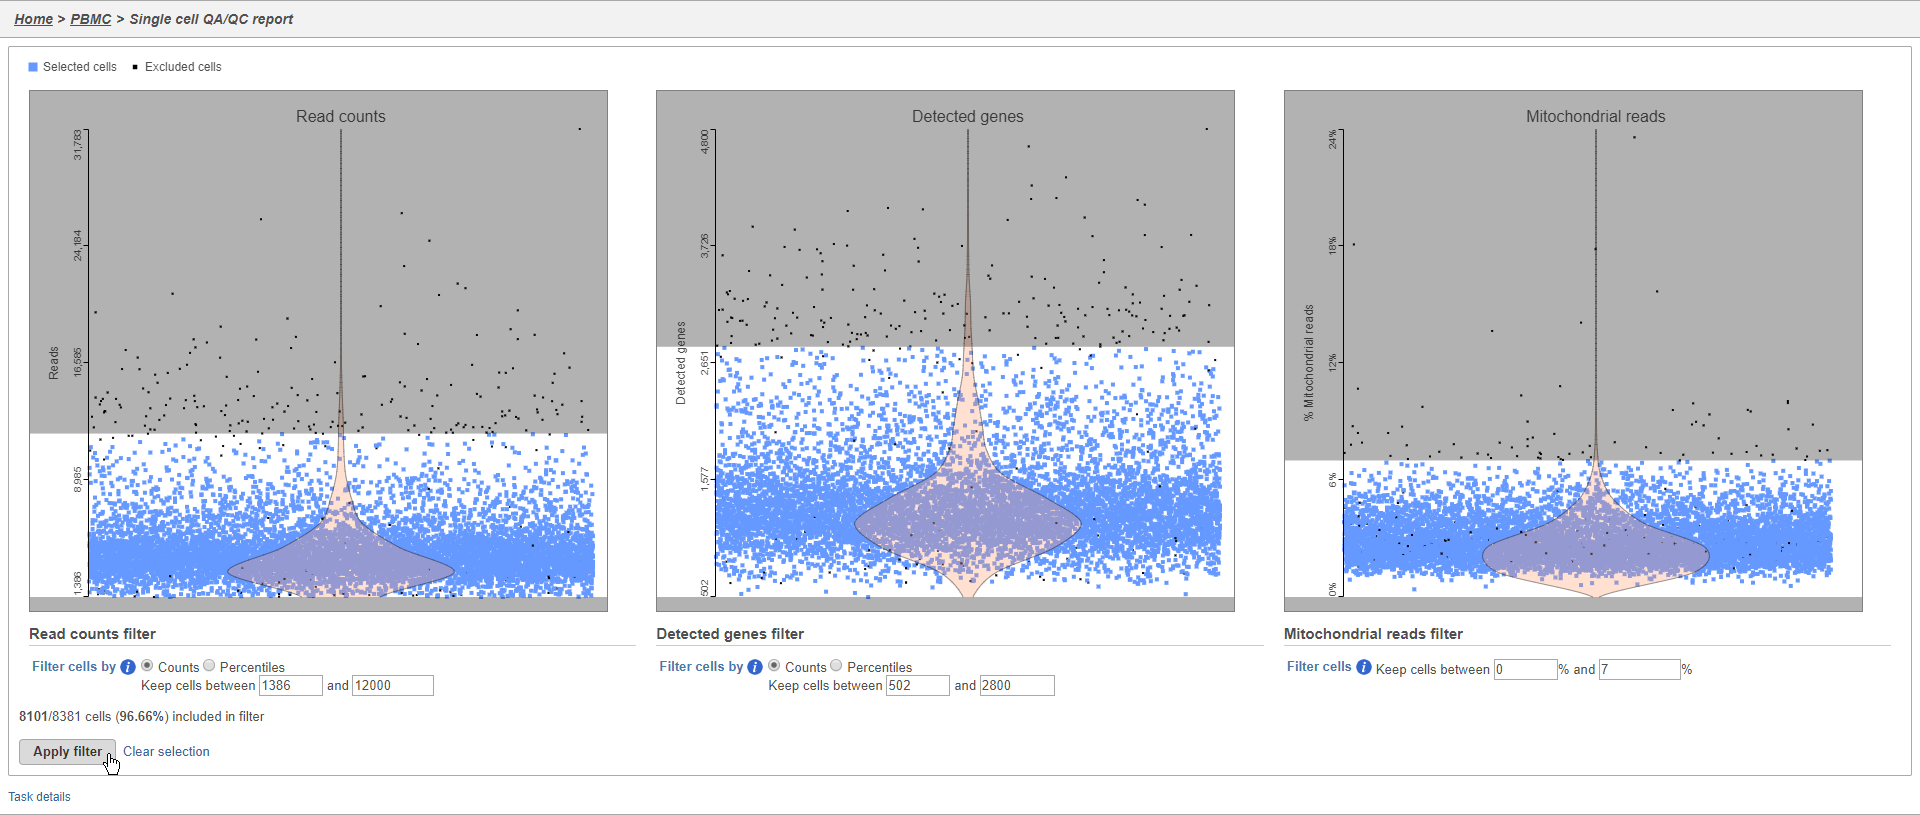
There are three plots: number of UMI counts per cell, number of detected genes per cell, and the percentage of mitochondrial counts per cell.
...
Overview
Content Tools