Page History
| Table of Contents | ||||||
|---|---|---|---|---|---|---|
|
Differential expression analysis can be used to compare cell types. Here, we will compare glioma and oligodendrocyte cells to identify genes differentially regulated in glioma cells from the Oligodendroglioma subtype. This comparison is of interest because glioma cells in Oligodendroglioma are thought to originate from oligodendrocytes.
...
Filtering samples
To analyze only the Oligodendroglioma subtype, we can filter the samples.
...
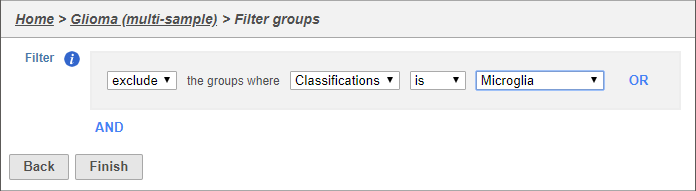
- Set the filter to Exclude groups where Classification is Microglia (Figure 4)
- Click Finish to apply the filter
| Numbered figure captions | ||||
|---|---|---|---|---|
| ||||
|
A Filtered Counts data node will be created with only glioma and oligodendrocyte cells from the Oligodendroglioma samples. The Filtered groups task must complete before we can proceed to identifying differentially expressed genes.
...
Identifying differentially expressed genes
- Click the second green Filtered counts data node
- Click Differential analysis in the task menu
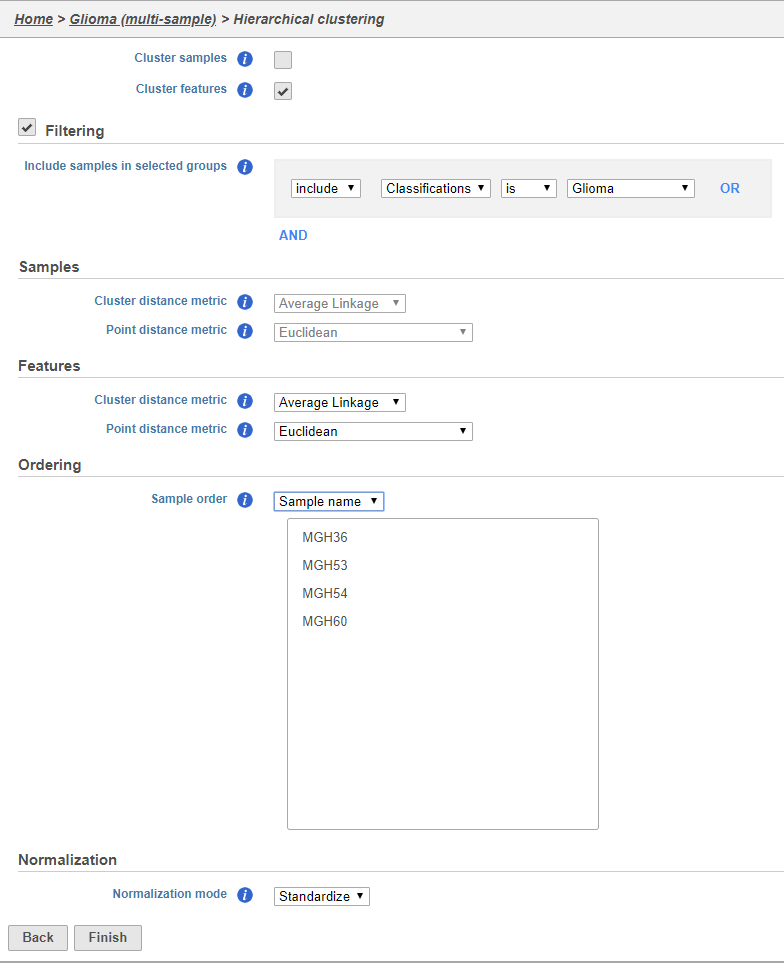
- Click ANOVA (Figure 5)
...
- Uncheck Cluster samples
- Click Filtering and set the filter to include Classifications is Glioma
- Choose Sample name from the Sample order drop-down menu in the Ordering section
- Click Finish
| Numbered figure captions | ||||
|---|---|---|---|---|
| ||||
|
...
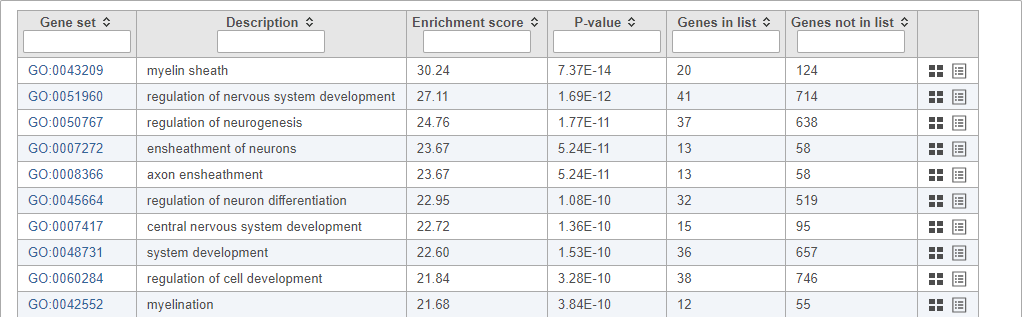
Top GO terms in the enrichment report include "myelin sheath", "ensheathment of neurons", and "axon ensheathment" (Figure 14), which corresponds well with the role of oligodendrocytes in creating the myelin sheath that supports and protect axons in the central nervous system.
| Numbered figure captions | ||||
|---|---|---|---|---|
| ||||
|
| Additional assistance |
|---|
|
| Rate Macro | ||
|---|---|---|
|
Overview
Content Tools