Page History
...
In Partek Flow, data are represented as circles, termed data nodes. One data node, Unaligned reads, should be visible in the analysis tab (Figure 1).
| Numbered figure captions | ||||
|---|---|---|---|---|
| ||||
|
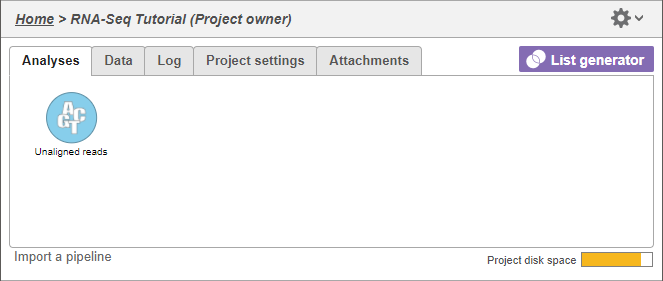
- Select the Unaligned reads data node
Selecting a data node brings up a context-sensitive task menu that lists tasks that can be performed on the data node (Figure 2).
| Numbered figure captions | ||||
|---|---|---|---|---|
| ||||
|
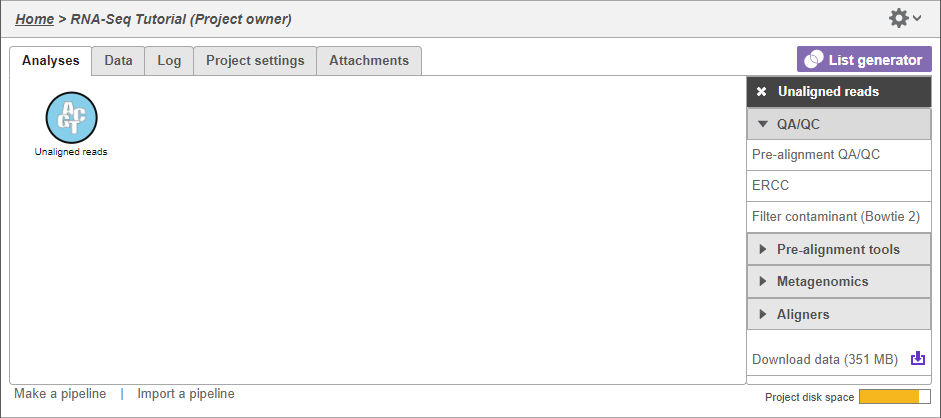
We will perform pre-alignment QA/QC to assess the quality of the unaligned reads and determine whether trimming or filtering is necessary.
...
Selecting a task creates a task node, e.g. the blue rectangle labeled Pre-alignment QA/QC (Figure 3). Selecting the task node will let us view the task report and the task details.
| Numbered figure captions | ||||
|---|---|---|---|---|
| ||||
|
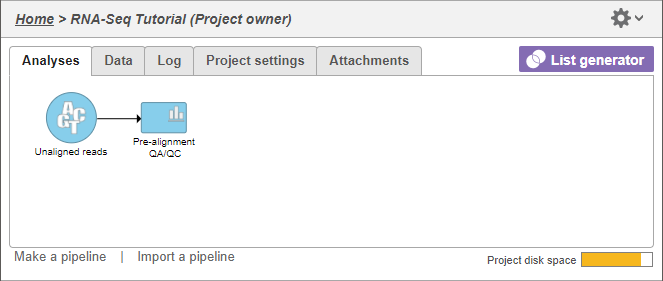
- Select the Pre-alignment QA/QC task node
The context-sensitive menu (Figure 4) shows the option to view the task report and the task details. You can also access a task report by double-clicking on a task node.
| Numbered figure captions | ||||
|---|---|---|---|---|
| ||||
|
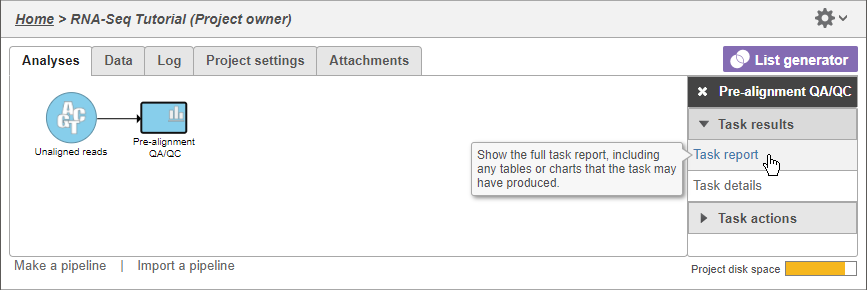
- Select Task report
Pre-aligment QA/QC provides information about the sequencing quality of unaligned reads. Both project level summaries and sample-level summaries are provided. To view sample-level summaries, select a sample from the data table in the report.
...
The Average base quality score per position graph (Figure 5) gives the average Phred score for each position in the reads.
| Numbered figure captions | ||||
|---|---|---|---|---|
| ||||
|
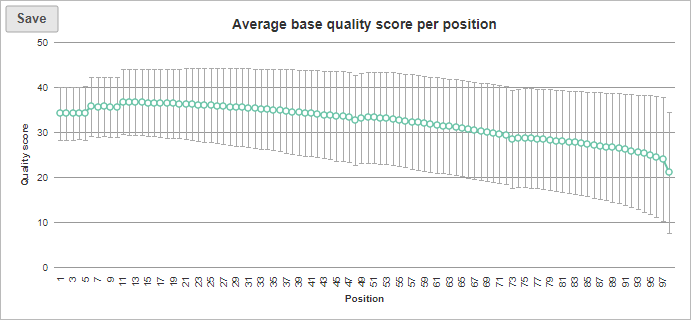
Based on the results of Pre-alignment QA/QC, while most of the reads are high quality, we will need to perform read trimming and filtering.
For more information about the information included in the task report, please see the Pre-aligment alignment QA/QC User Guide user guide.
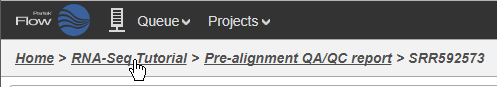
To return to the analysis tab from the Pre-alignment QA/QC report, select the project name from the hierarchy of links in the upper left-hand corner of the task report page (Figure)
| Numbered figure captions | ||||
|---|---|---|---|---|
| ||||
|
| Additional assistance |
|---|
|
| Rate Macro | ||
|---|---|---|
|
Overview
Content Tools