Page History
...
| Numbered figure captions | ||||
|---|---|---|---|---|
| ||||
|

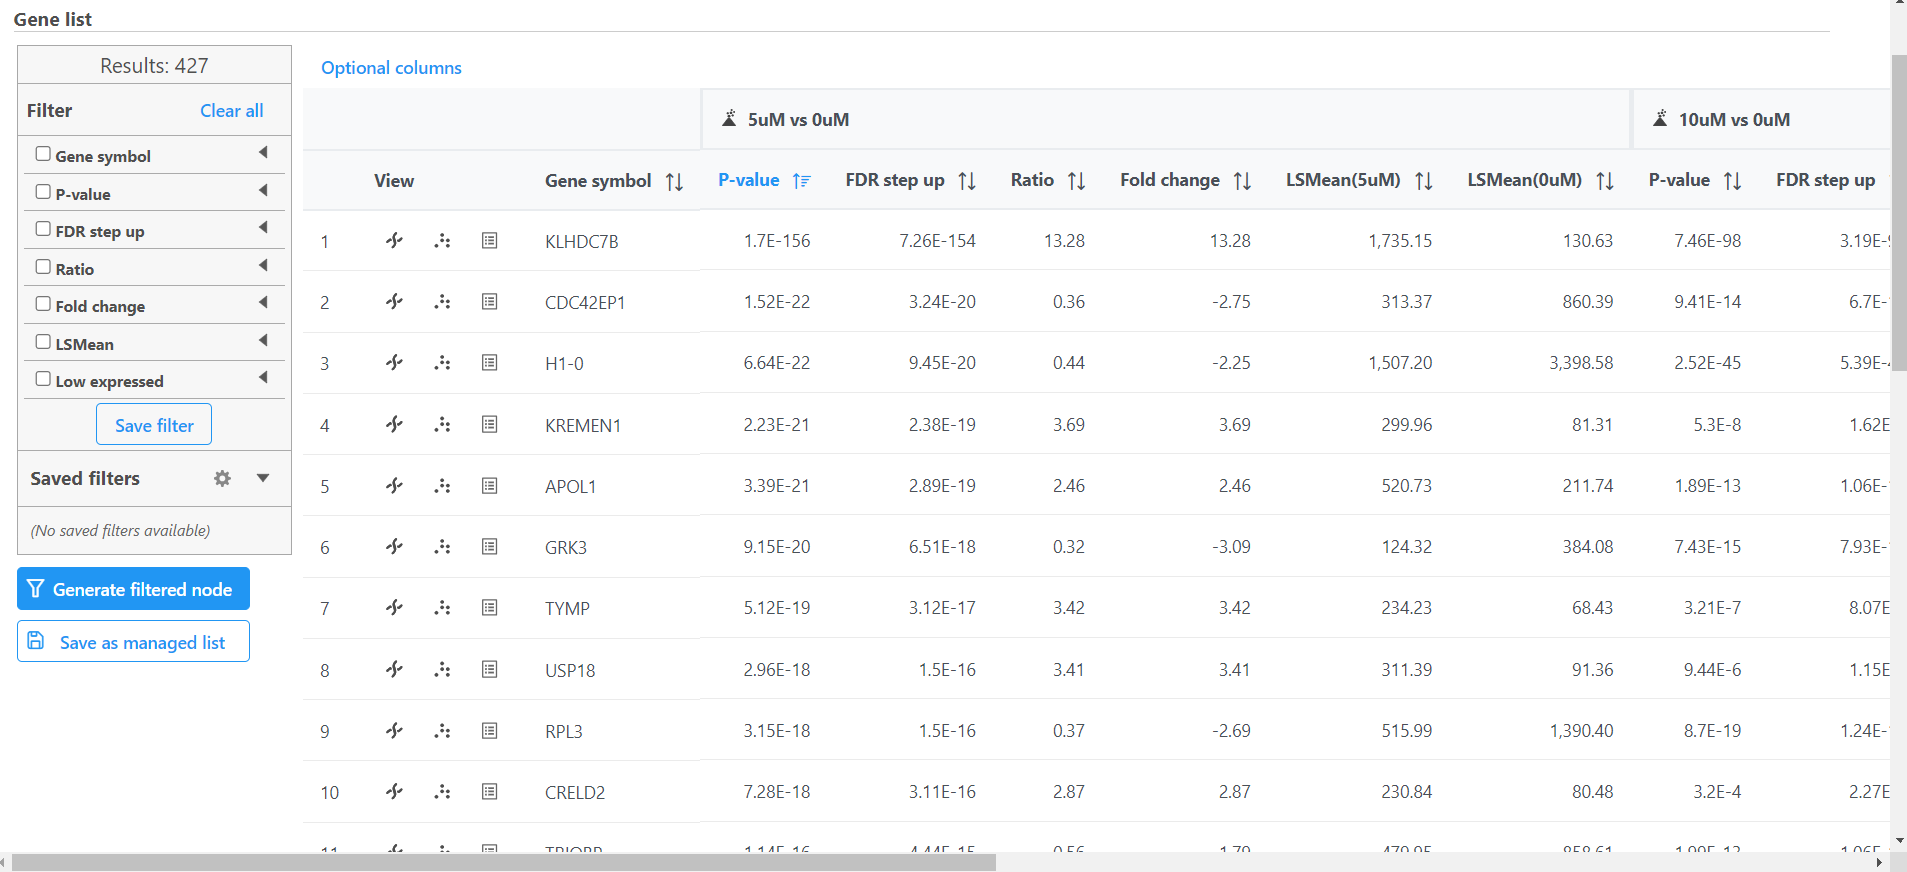
To get a sense of what filtering thresholds to set, we can view a volcano plot for a comparison.
...
Thresholds for the cutoff lines are set using the Significance card Statistics card (Configuration panel > Content Configure > SignificanceStatistics). The default thresholds are |2| for the X axis and 0.05 for the Y axis.
...
Overview
Content Tools