Join us for a webinar: The complexities of spatial multiomics unraveled
May 2
Page History
| Table of Contents | ||||||
|---|---|---|---|---|---|---|
|
The primary use of the Dot Plot dot plot is visualizing intensity values across samples.
We will invoke a Dot Plot dot plot from a gene list child spreadsheet with genes on rows.
...
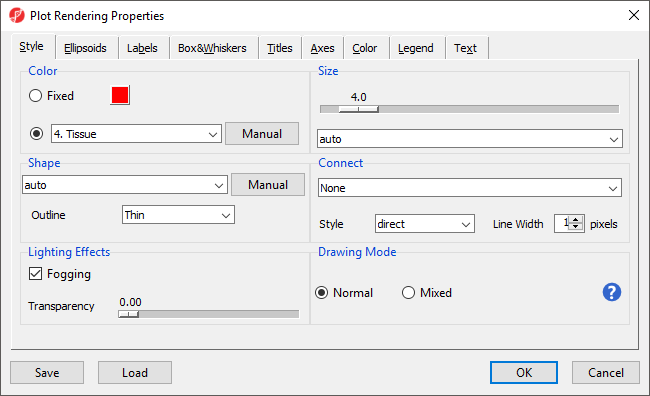
- Select Plot Properties (
 ) from the plot command bar to launch the Plot Properties dialog (Figure 4).
| Numbered figure captions | ||||
|---|---|---|---|---|
| ||||
|
...
- Set Shape to 3. Type using the drop-down menu
- Select Select the Box&Whiskers from the dialog tabstab
- Set Box Width to 15 pixels
- Select Titles from the dialog tabsSelect the Titles tab
- Set X-Axis under Configure Axes Titles to Tissue
- Select OK to modify the plot
...
Legends can now be dragged and dropped to new locations on the plot. Samples can be selected by left-clicking the sample or left-clicking and dragging a box around samples.
...
Overview
Content Tools