Page History
...
- Invoke the List Manager dialog by selecting Create Gene List in the Analysis section of the Gene Expression workflow
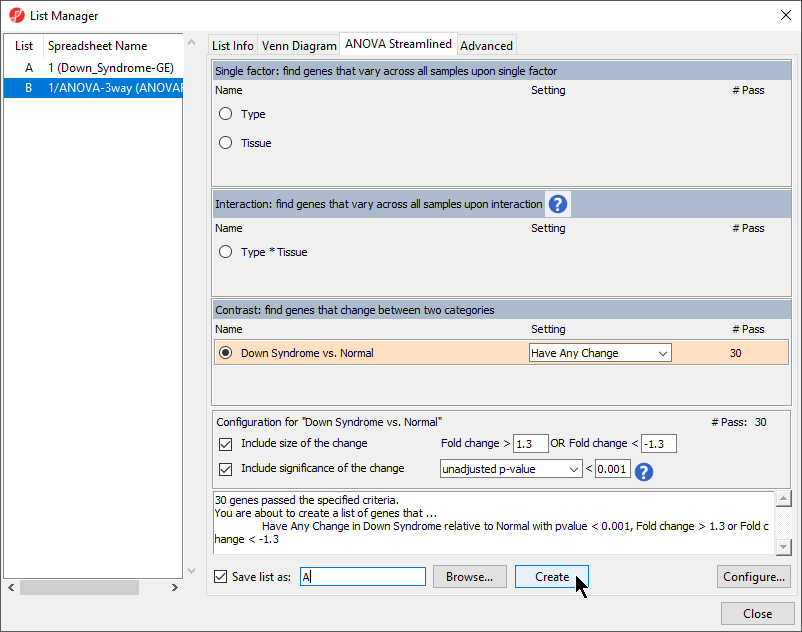
- Ensure that the 1/ANOVA-3way (ANOVAResults) spreadsheet is selected as this is the spreadsheet we will be using to create our new gene list as shown (Figure 9)
- Select the ANOVA Streamlined tab. In the Contrast: find genes that change between two categories panel, choose Down Syndrome vs. Normal and select Have Any Change from the Setting dropdown menu list. This will find genes with different expression levels in the different types of samples
- In the Configuration for “Down Syndrome vs Normal” panel, check that Include size of the change is selected and enter 1.3 into Fold change > and -1.3 in OR Fold change <
- Select Include significance of the change, choose unadjusted p-value from the dropdown menu, and < 0.0005 001 for the cutoff. The number of genes that pass your cutoff criteria will be shown next to the # Pass field. In this example, 23 30 genes pass the criteria.
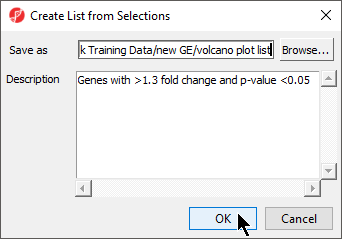
- Set Save the list as A, select Create, and then select Close to view the new gene list spreadsheet
| Numbered figure captions | ||||
|---|---|---|---|---|
| ||||
|

The spreadsheet Down_Syndrome_vs_Normal (A) will be created as a child spreadsheet under the Down_Syndrome-GE spreadsheet.
...
| Numbered figure captions | ||||
|---|---|---|---|---|
| ||||
|

- Set X Axis (Fold-Change) to 12. Fold-Change(Down Syndrome vs. Normal), and the Y axis (p-value) to be 1110. p-value(Down Syndrome vs. Normal)
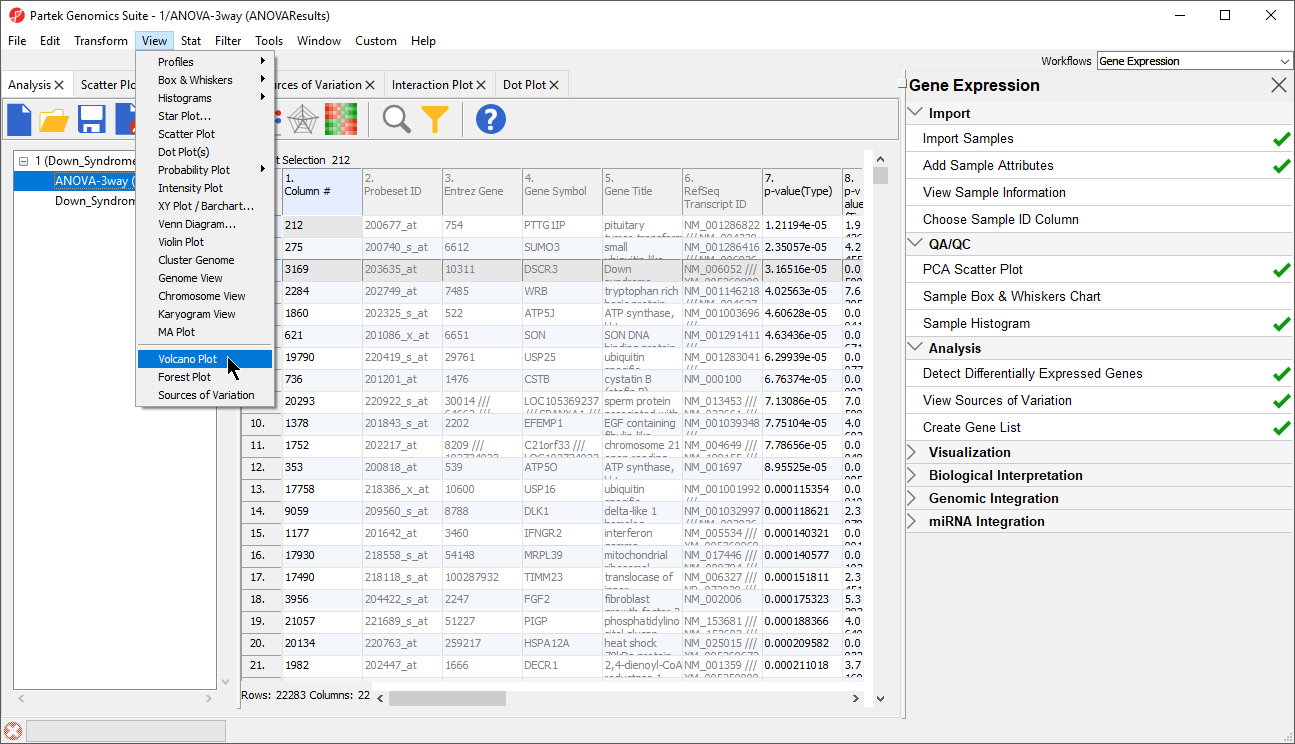
- Select OK to generate a Volcano Plot tab for genes in the ANOVA spreadsheet (Figure 11)
| Numbered figure captions | ||||
|---|---|---|---|---|
| ||||
|

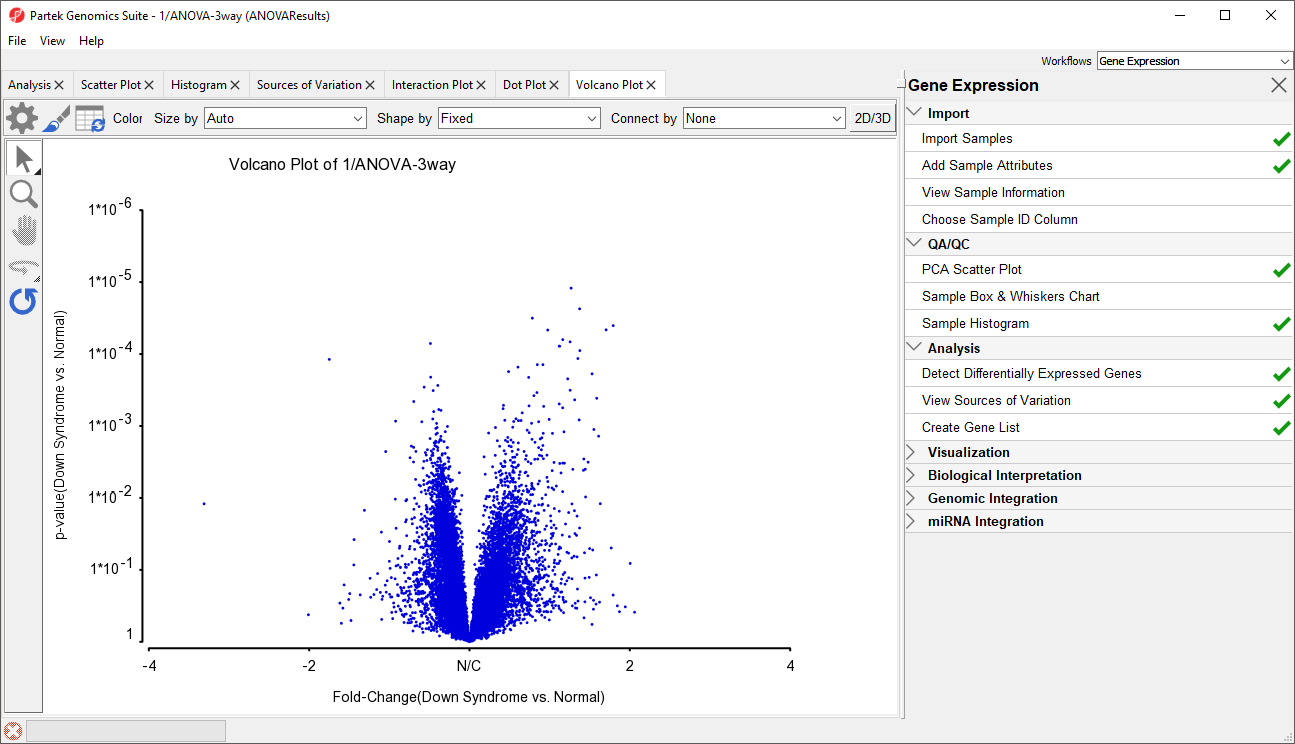
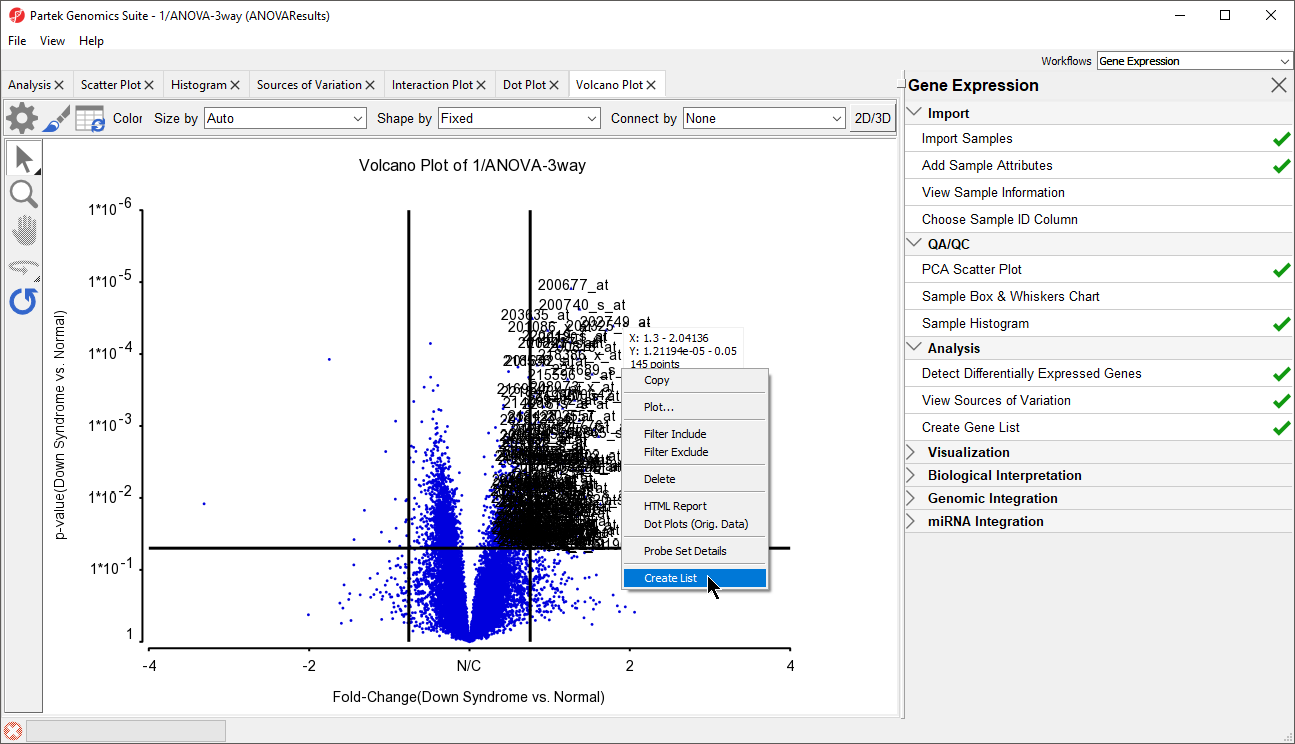
In the plot, each dot represents a gene. The X-axis represents the fold change of the contrast (Down syndrome vs. Normal), and the Y-axis represents the range of p-values. The genes with increased expression in Down syndrome samples are on the right side of the N/C (no change) line; genes with reduced expression in Down syndrome samples are on the left. The genes become more statistically significant with increasing Y-axis position. The genes that have larger and more significant changes between the Down syndrome and normal groups are on the upper right and upper left corner.
...
| Numbered figure captions | ||||
|---|---|---|---|---|
| ||||
|

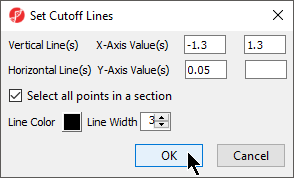
- Select OK to draw the cutoff lines
- Select OK in the Plot Rendering Properties dialog to close the dialog and view the plot
...
| Numbered figure captions | ||||
|---|---|---|---|---|
| ||||
|

Note: If no column is selected in the parent (ANOVA) spreadsheet, all of the columns will be included in the gene list; if some columns are selected, only the selected columns will be included in the list.
...
| Numbered figure captions | ||||
|---|---|---|---|---|
| ||||
|

| Page Turner | ||
|---|---|---|
|
...
Overview
Content Tools