Page History
...
| Numbered figure captions | ||||
|---|---|---|---|---|
| ||||
|
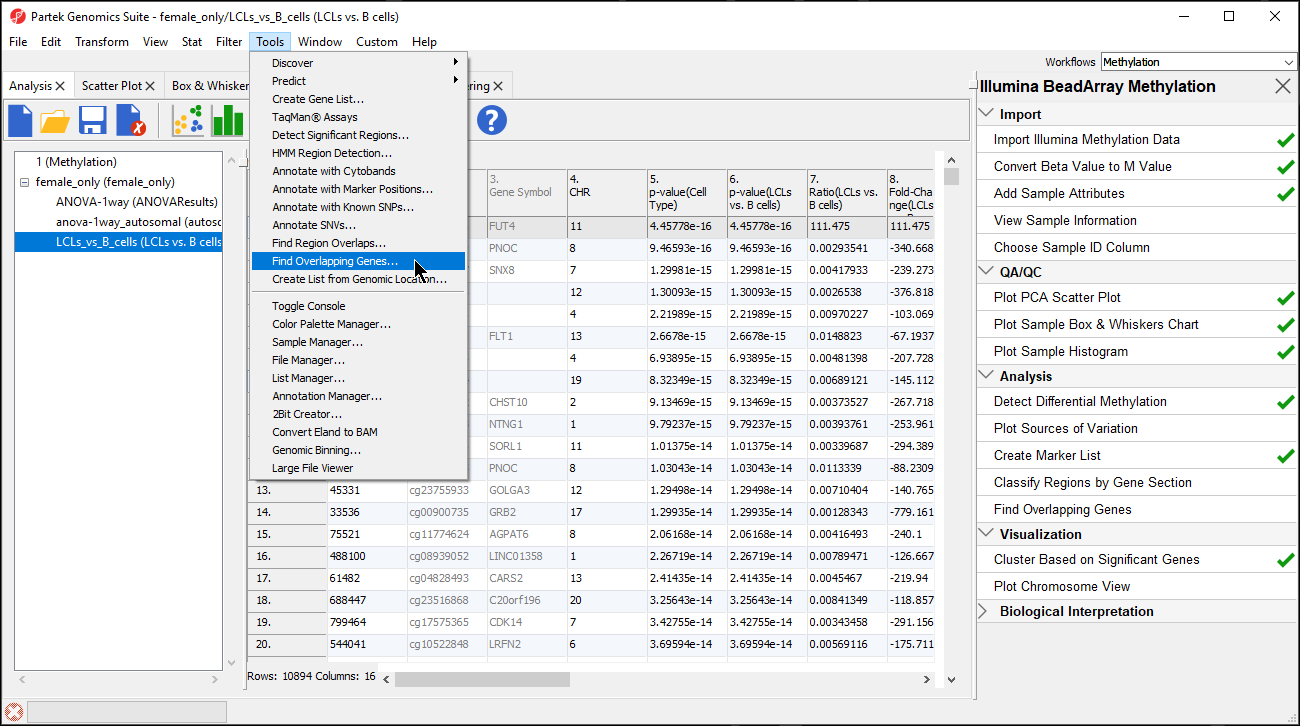
- Select Create a new spreadsheet with genes that overlap with the regions in the Find Overlapping Genes dialog
- Select OK
- Select an annotation - this tutorial uses RefSeq Transcripts - 2014-01-03
- You can select a name for the new list, we have named it gene-list
- Select OK
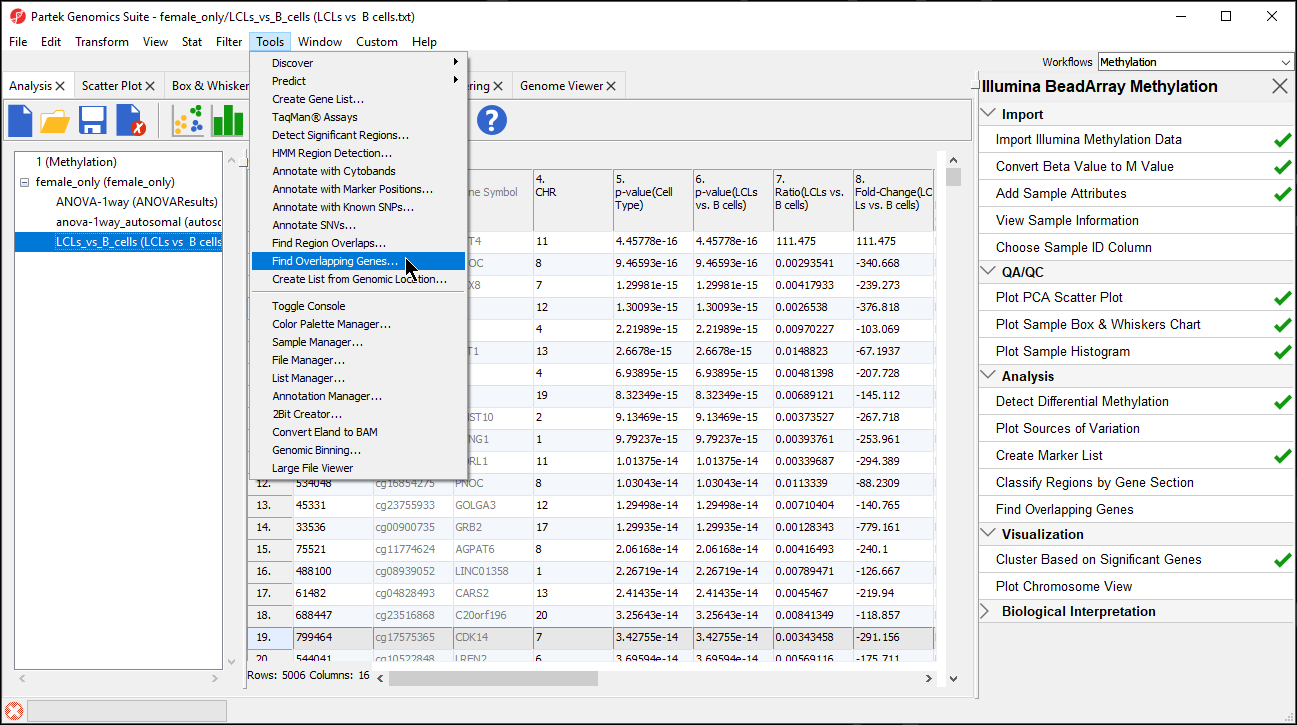
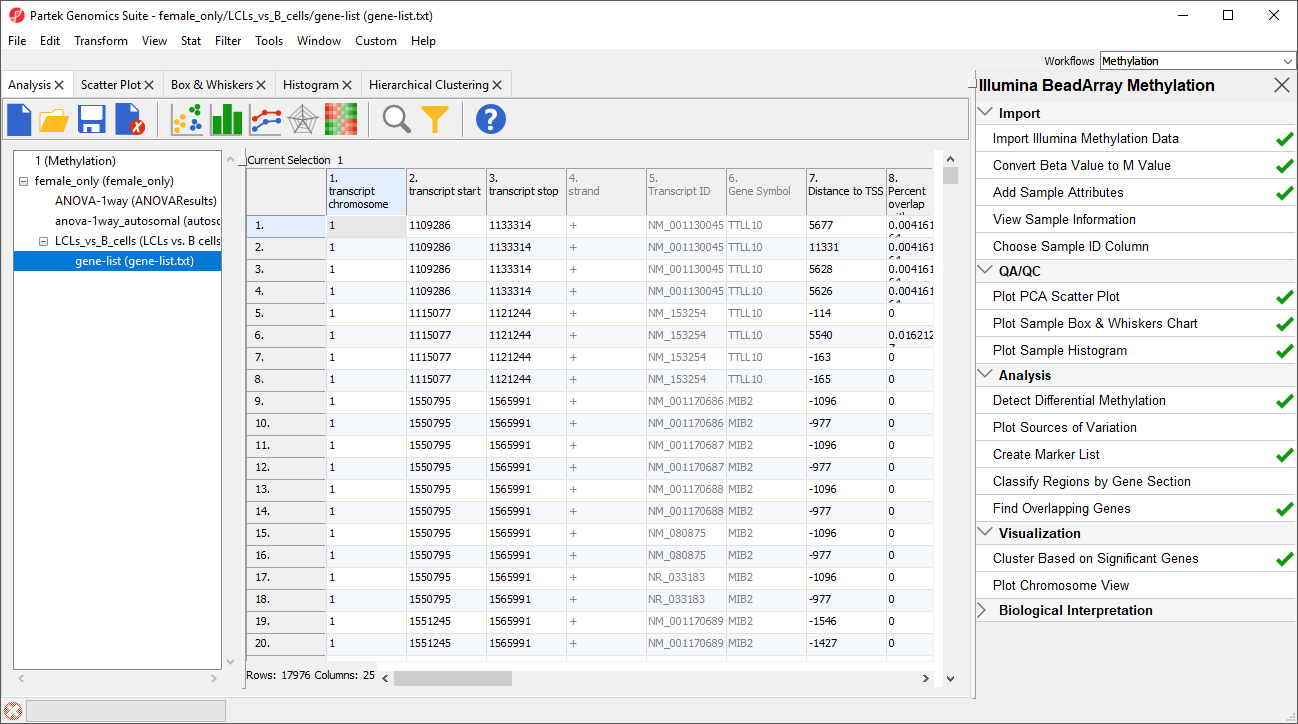
A new spreadsheet will be created as a child spreadsheet (Figure 2)
| Numbered figure captions | ||||
|---|---|---|---|---|
| ||||
|
...
| Numbered figure captions | ||||
|---|---|---|---|---|
| ||||
|
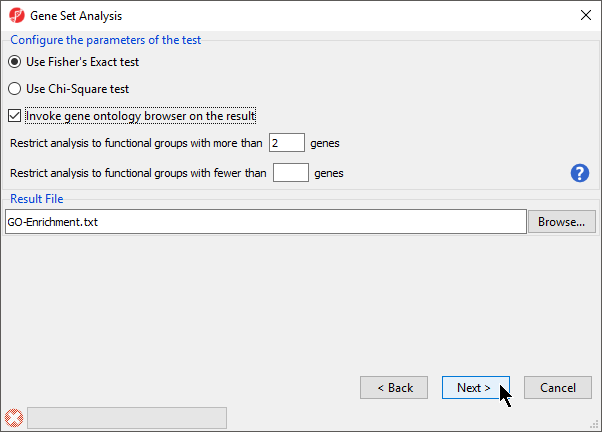

- Select Next >
- Select Default Mapping File for Select the method of mapping genes to genes sets
- Select Next >
...
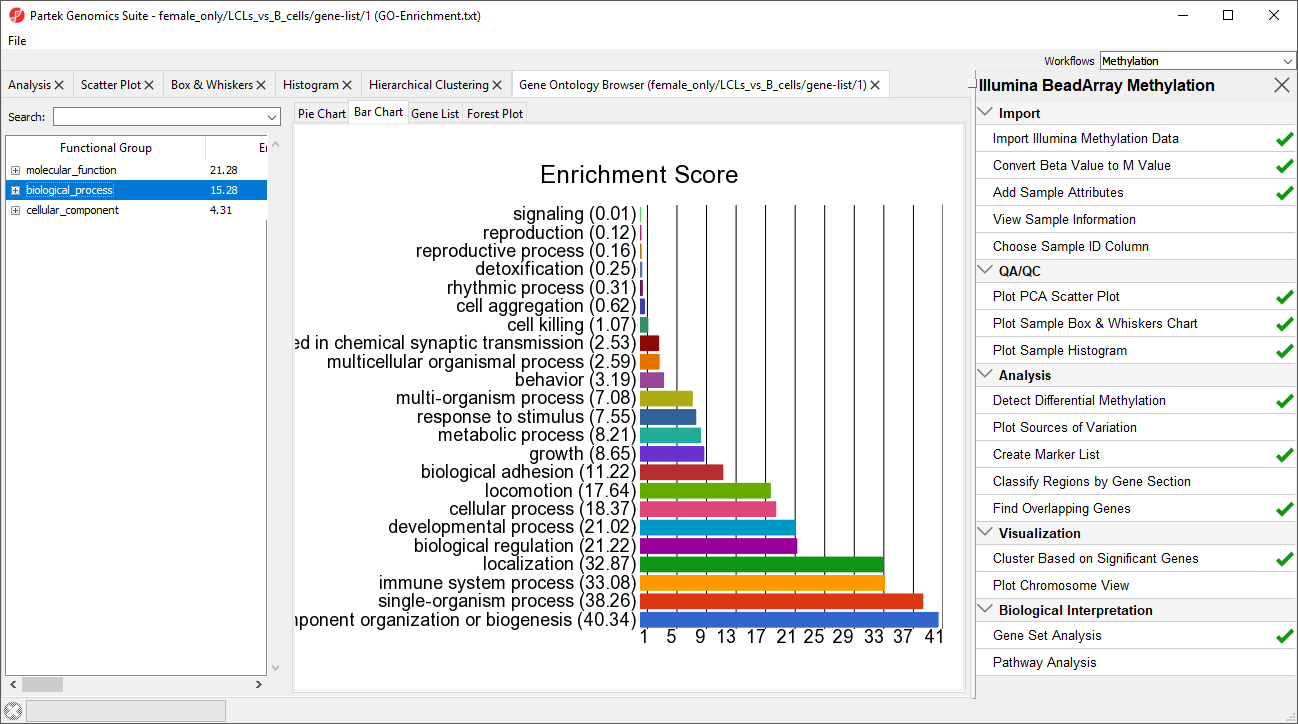
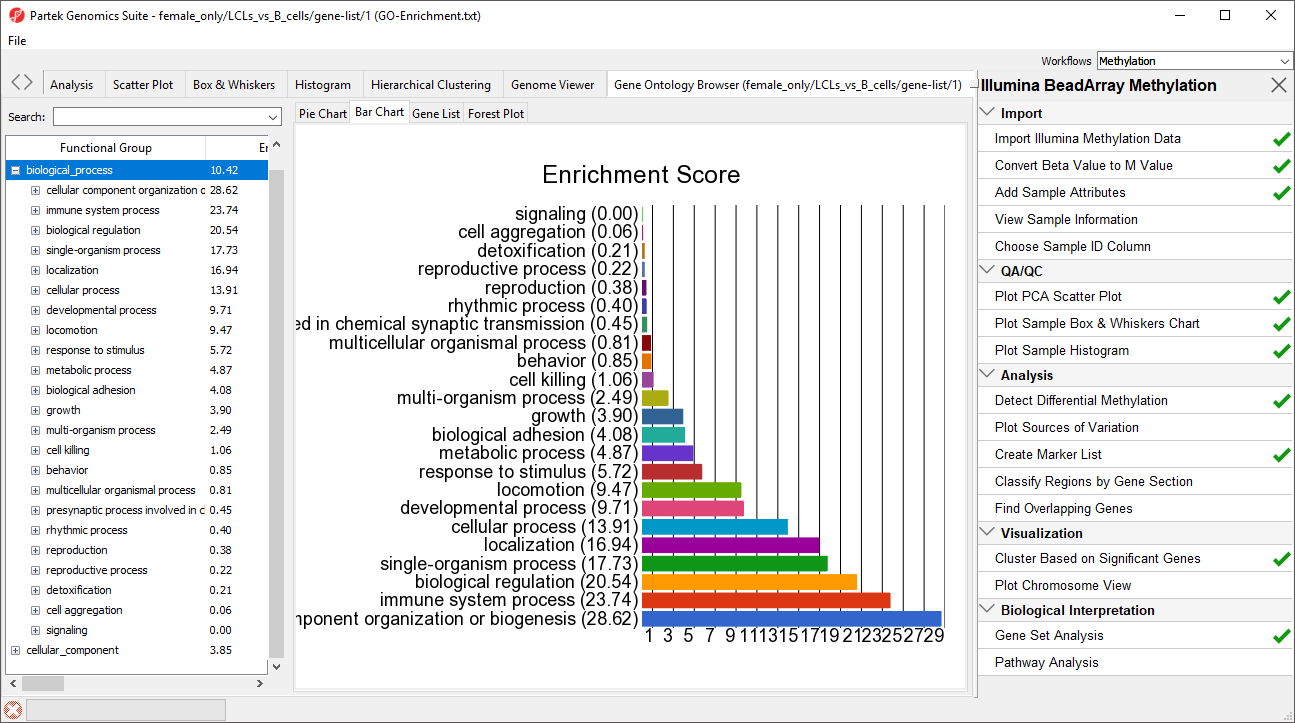
| Numbered figure captions | ||||
|---|---|---|---|---|
| ||||
|
...
ThePathway-Enrichment spreadsheet will be added to the spreadsheet tree in Partek Genomics Suite and the Partek® Pathway™ software will open to provide visualization of the most significantly enriched pathway as a pathway diagram (Figure 4). The color of the gene boxes reflects p-values of the associated differentially methylated CpG loci (bright orange is insignificant, purple blue is highly significant). The Color by option can be changed another column from the gene-list.txt spreadsheet.
...
| Numbered figure captions | ||||
|---|---|---|---|---|
| ||||
|

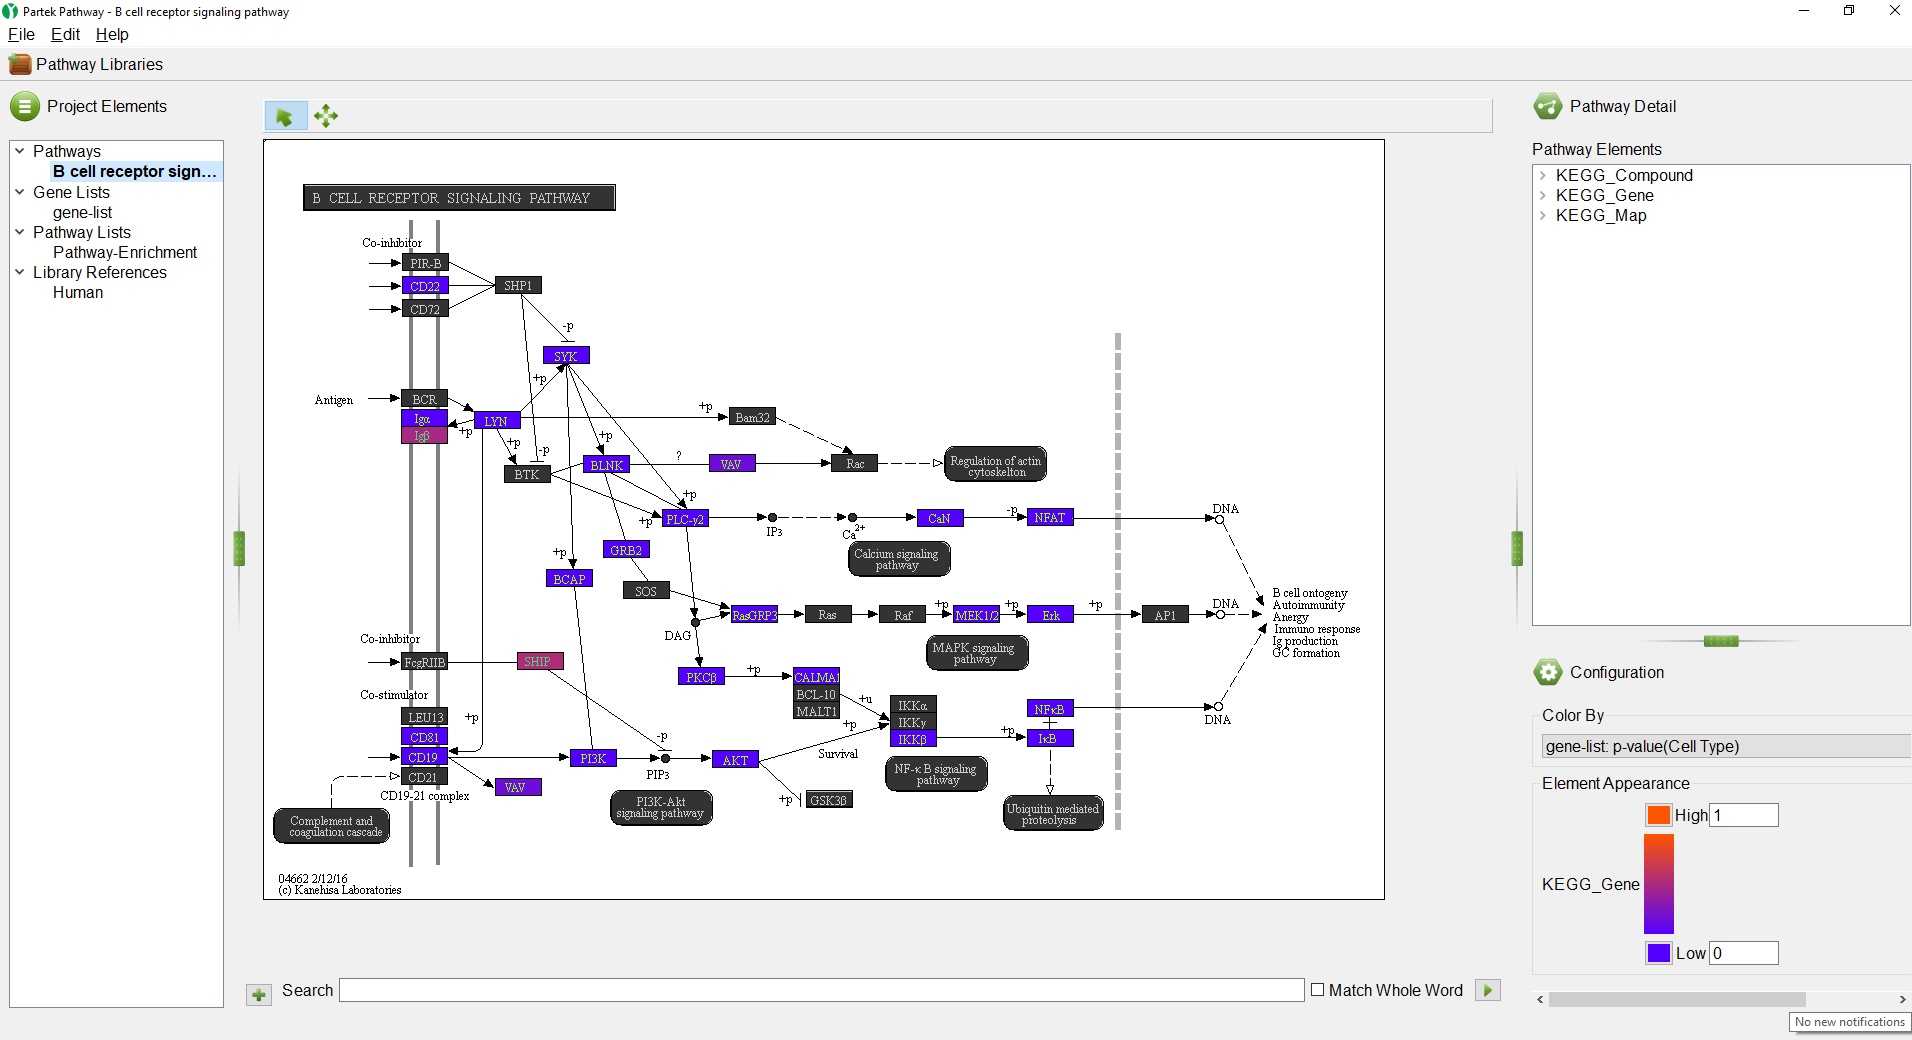
The Pathway-Enrichment spreadsheet can also be viewed in Partek Pathway by switching to the Pathway-Enrichment section of the menu tree on the left-hand side of the window. From the spreadsheet view, you can select a pathway name to visualize that pathway. Alternatively, you can open a pathway visualization in Partek Pathway from the Pathway-Enrichment spreadsheet in Partek Genomics Suite by right-clicking on a row and selecting Show pathway... from the pop-up menu. Please note that if you have closed Partek Pathway and have reopened it, you will need to import a gene list if you want to color the visualization by attributes form the gene list. For more information about using Partek Pathway, consult the User's Guide section on for Partek Pathway.
Comment
Please link out to the appropriate document
| Page Turner | ||
|---|---|---|
|
| Additional assistance |
|---|
|
| Rate Macro | ||
|---|---|---|
|
Overview
Content Tools