Page History
...
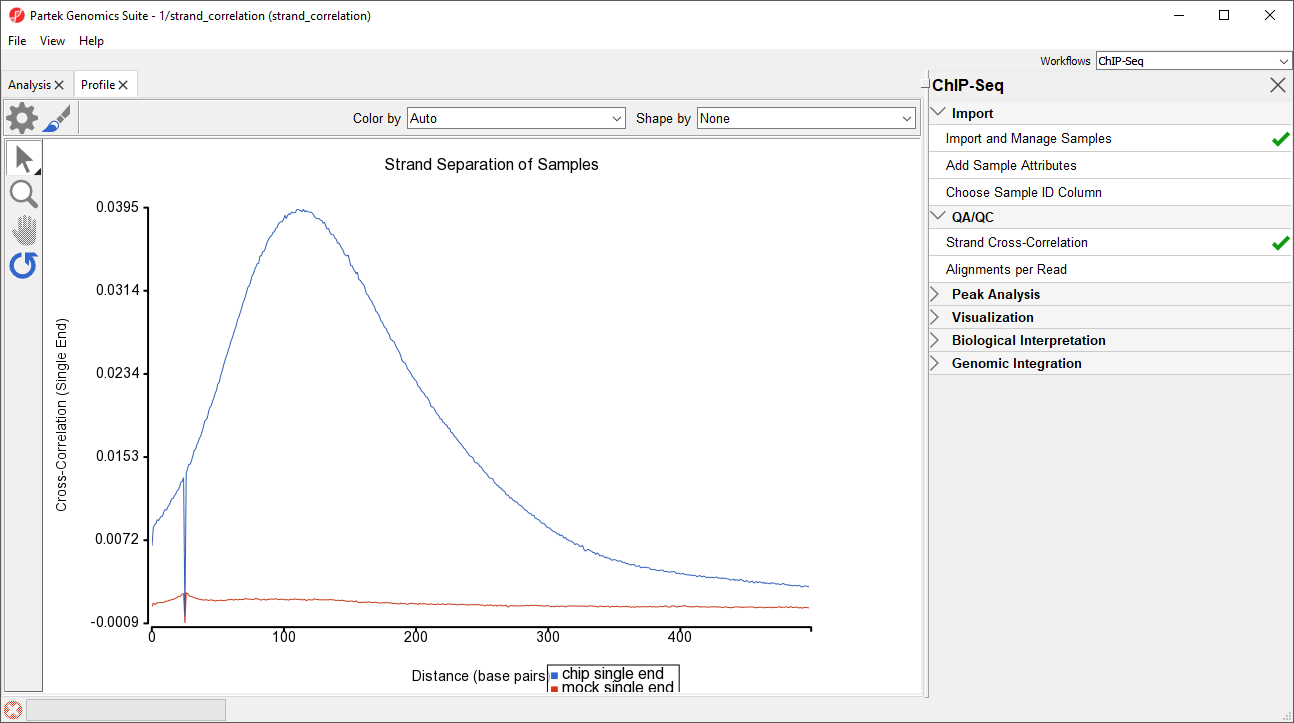
After running Strand Cross-Correlation, the Strand Separation of Samples viewer will open as a new tab (Figure 1).
| Numbered figure captions | ||||
|---|---|---|---|---|
| ||||
|
...
The titles of columns 2. 0 Single End Alignments Per Read and 3. 1 Single End Alignment Per Read indicate that this is single end data. Column 2 shows the number of unaligned reads, while column 3 shows the number of reads that aligned exactly once. If the BAM files used in this tutorial included reads that mapped to more than one location in the genome, there would be additional columns.
| Page Turner | ||
|---|---|---|
|
| Additional assistance |
|---|
|
| Rate Macro | ||
|---|---|---|
|
Overview
Content Tools