Page History
...
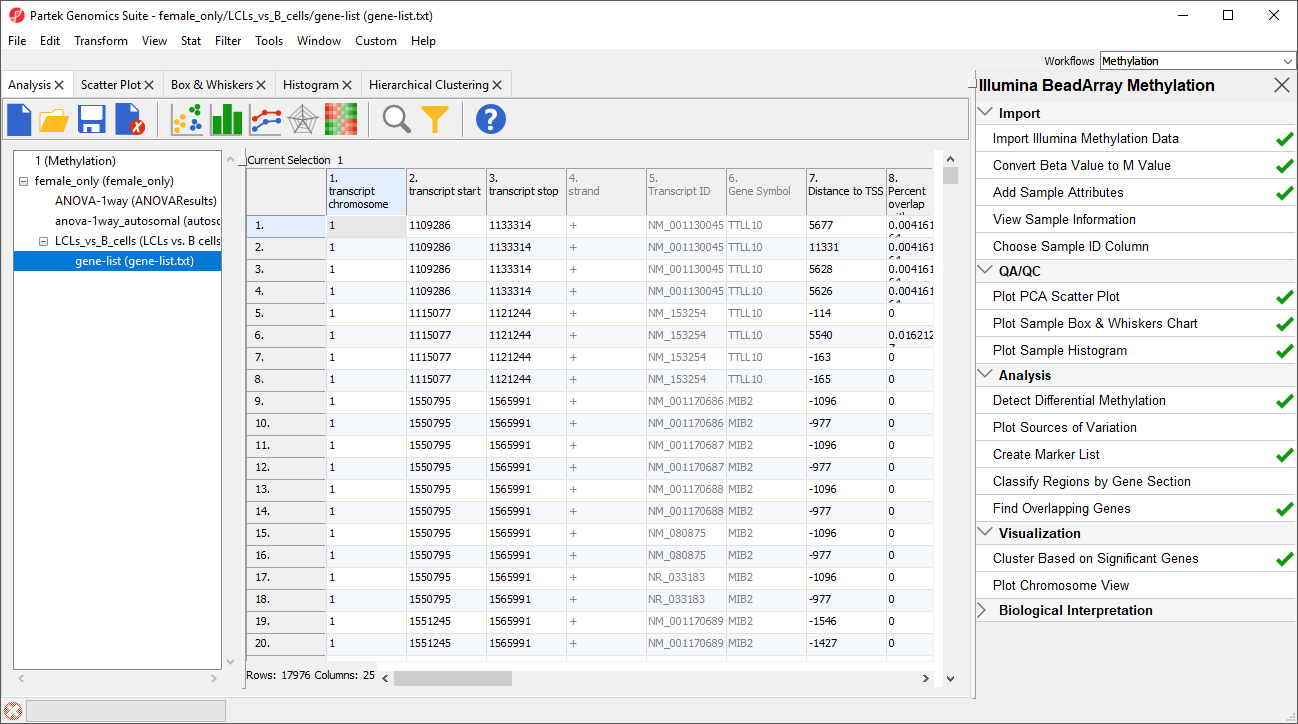
A new spreadsheet will be created as a child spreadsheet (Figure 2)
| Numbered figure captions | ||||
|---|---|---|---|---|
| ||||
|
- Select Gene Set Analysis from the Biological Interpretation section of the Illumina BeadArray Methylation workflow
- Select GO Enrichment for Select the method of analysis
- Select Next >
- Select female_only/LCLs_vs_B_cells/gene-list (gene-list.txt) for the source spreadsheet
- Select Next >
- Select Invoke gene ontology browser on the result and leave the rest of the options set to defaults for Configure the parameters of the test (Figure 3)
...
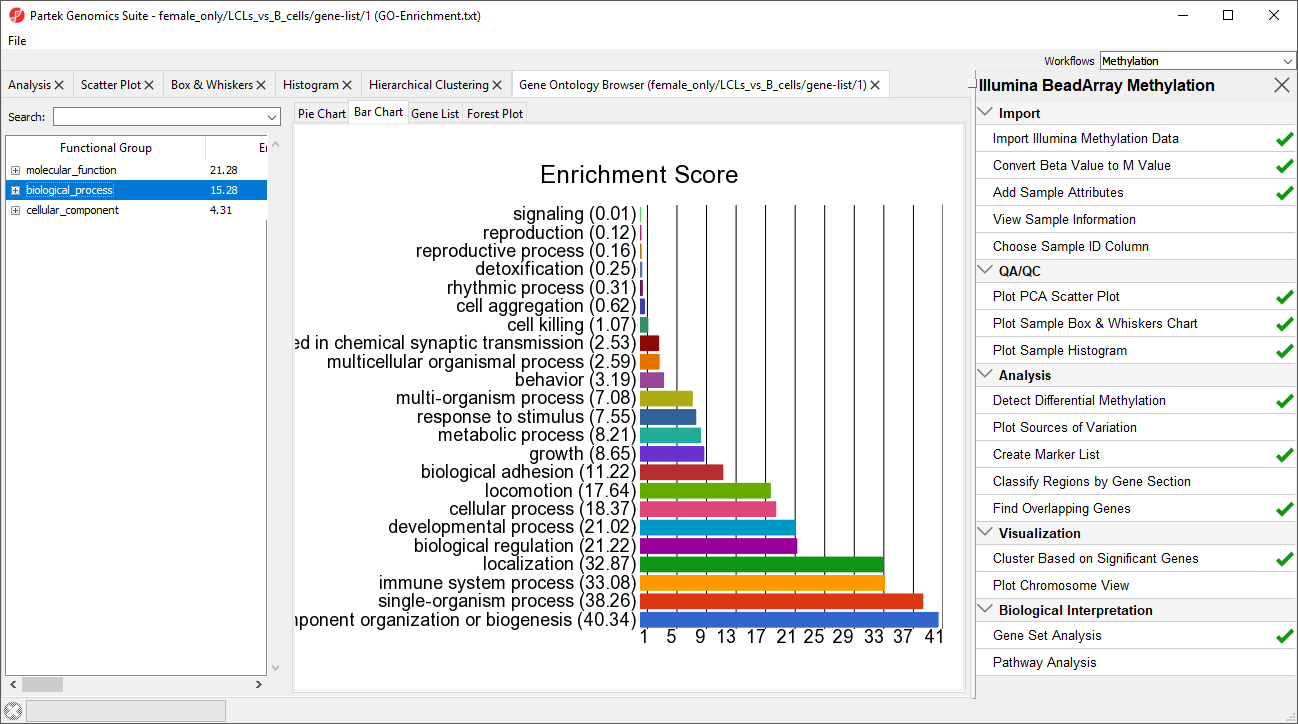
A new spreadsheet will be created with categories ranked by enrichment score and the Gene Ontology Browser will launch to graphically display the results of the spreadsheet (Figure 4). The results show which gene sets are over represented in the list of genes overlapped by differentially regulated CpG loci between the experimental and control groups.
| Numbered figure captions | ||||
|---|---|---|---|---|
| ||||
|
...
The Pathway-Enrichment spreadsheet can also be viewed in Partek Pathway by switching to the Pathway-Enrichment section of the menu tree on the left-hand side of the window. From the spreadsheet view, you can select a pathway name to visualize that pathway. Alternatively, you can open a pathway visualization in Partek Pathway from the Pathway-Enrichment spreadsheet in Partek Genomics Suite by right-clicking on a row and selecting Show pathway... from the pop-up menu. Please note that if you have closed Partek Pathway and have reopened it, you will need to import a gene list if you want to color the visualization by attributes form the gene list. For more information about using Partek Pathway, consult the User's Guide section on Partek Pathway.
| Comment |
|---|
Please link out to the appropriate document |
| Page Turner | ||
|---|---|---|
|
| Additional assistance |
|---|
|
| Rate Macro | ||
|---|---|---|
|
Overview
Content Tools