Join us for a webinar: The complexities of spatial multiomics unraveled
May 2
Page History
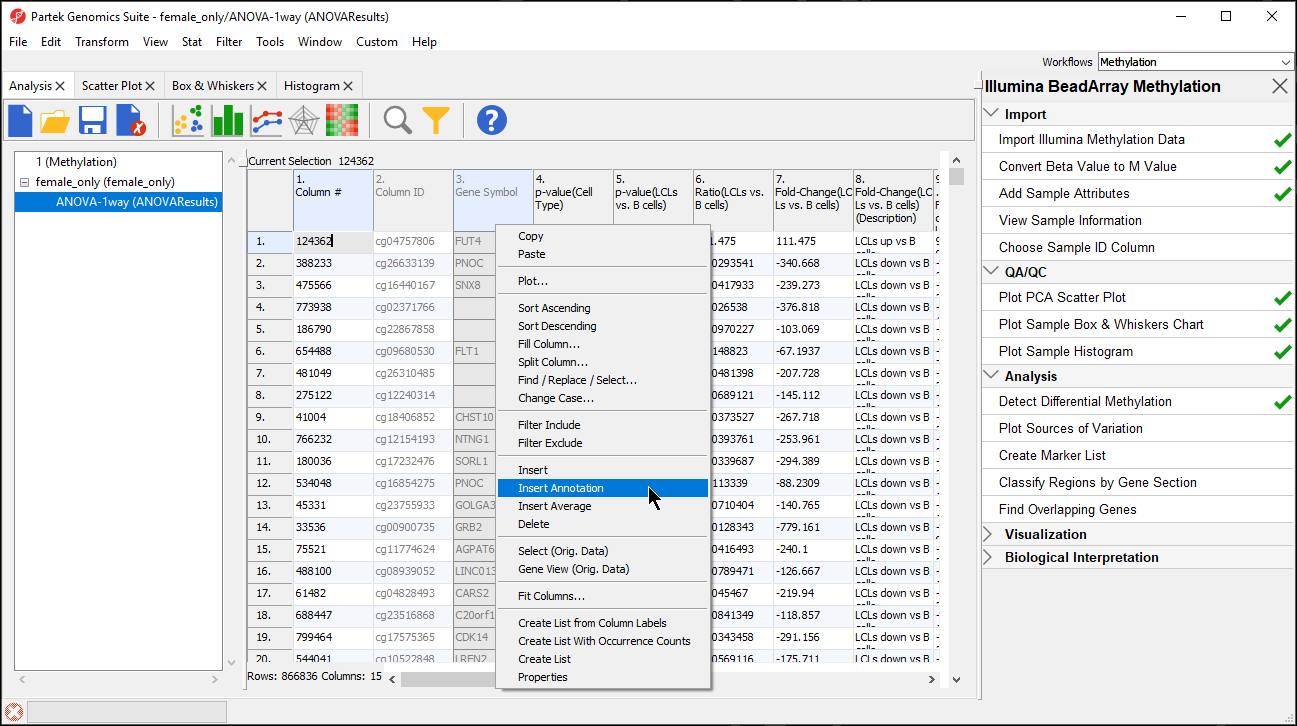
Analysis of differentially methylated loci in humans and mice typically includes exclusion of the probes on X and Y chromosomes because of the difficulties caused by the inactivation of one X chromosome in female samples. To filter out probes from the X and Y chromosomes, we first need to annotate the ANOVA spreadsheet with chromosome locations.
- Right-click on the Gene Symbol column
- Select Insert Annotation (Figure 1)
| Numbered figure captions | ||||
|---|---|---|---|---|
| ||||
|
- Select the Add as categorical option
- Select CHR (Figure 2)
| Numbered figure captions | ||||
|---|---|---|---|---|
| ||||
|
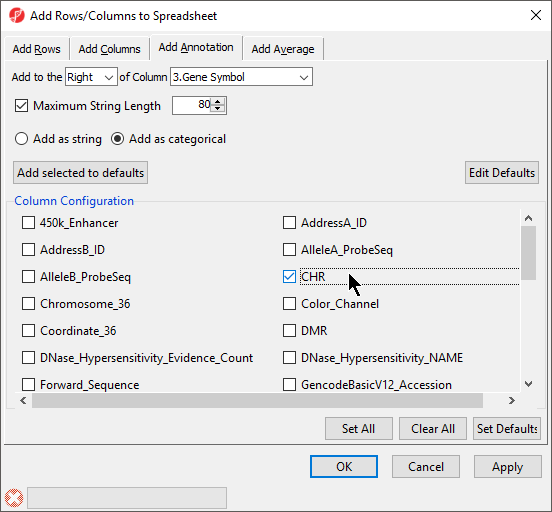
- Select OK to add chromosome as a column in next to 3. Gene Symbol
- Select (
 ) from the quick action bar to save the ANOVA-1way (ANOVA Results) spreadsheet with the added annotation
Now, we can filter probes by chromosome location.
- Select (
 ) from the quick action bar to invoke the interactive filter
 - Select 4. CHR for Column
For categorical columns, the interactive filter displays each category of the selected column as a colored bar. For 4. CHR, each bar represents a chromosome with the height of bar representing the number of probes from that chromosome in the selected spreadsheet. To filter out a category, left-click on its bar. Right clicking on a bar will include only the selected category. A pop up balloon will show the category label as you mouse over each bar.
- Left-click the X and Y chromosome columns to filter them out (Figure 3)
| Numbered figure captions | ||||
|---|---|---|---|---|
| ||||
|
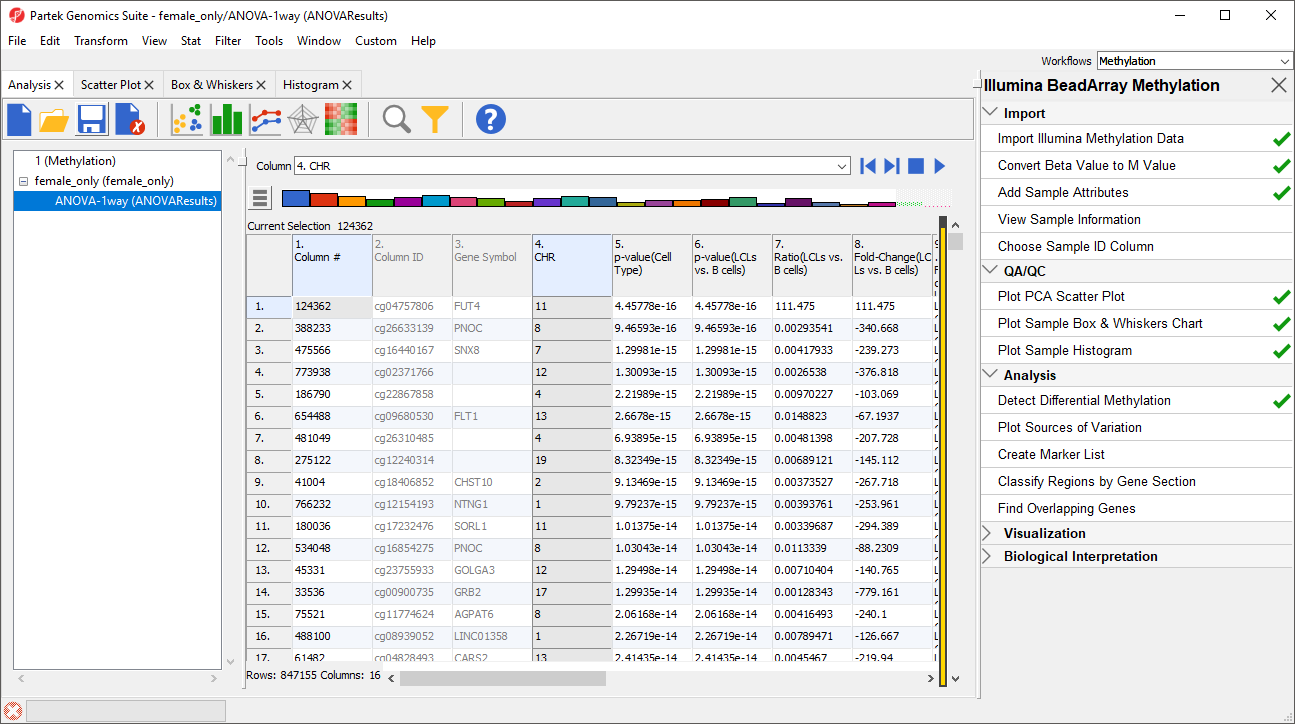
The yellow and black bar on the right-hand side of the spreadsheet panel shows the fraction of excluded cells in black and included cells in yellow. Right-clicking this bar brings up an option to clear the filter.
Now that we have filtered out probes on the X and Y chromosomes, we will create a spreadsheet containing only probes on the autosomes.
- Right click on the ANOVA-1way (ANOVAResults) spreadsheet in the spreadsheet tree panel (Figure 4)
| Numbered figure captions | ||||
|---|---|---|---|---|
| ||||
|
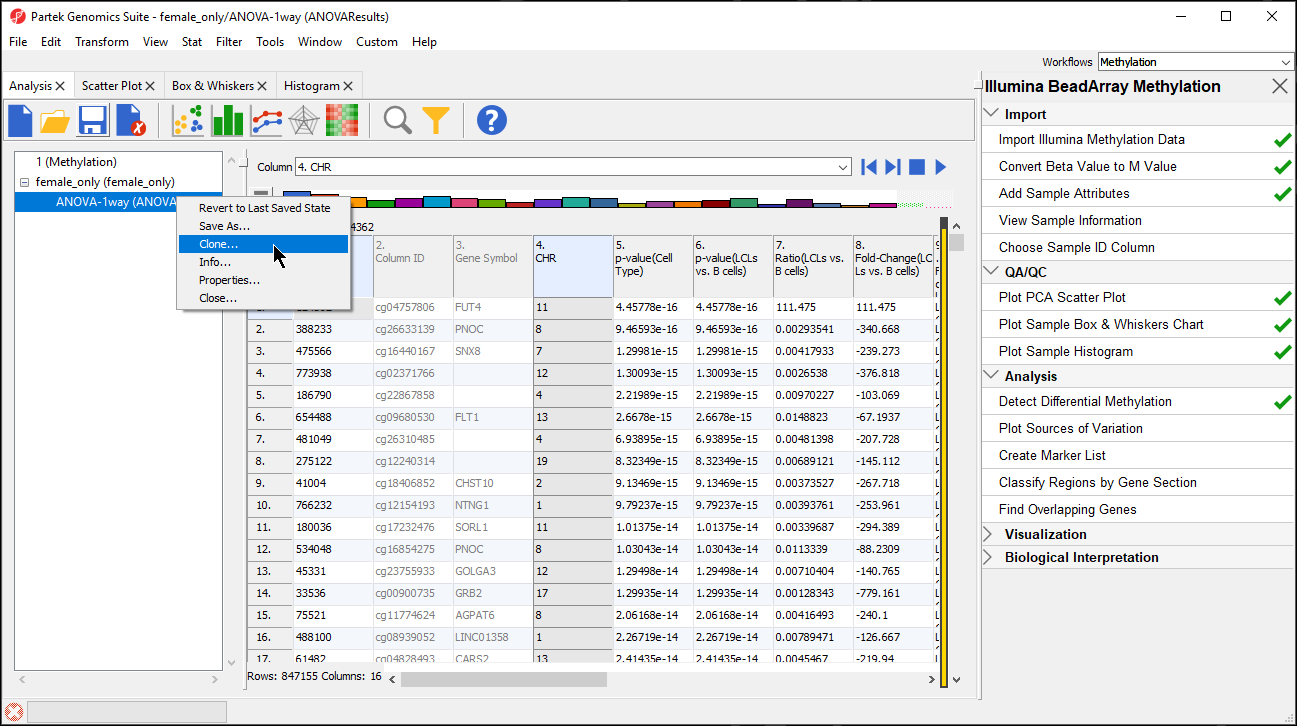
- Select Clone
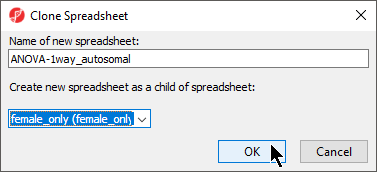
- Rename the new spreadsheet ANOVA-1way_autosomal using the Clone Spreadsheet dialog
- Select female_only from the Create new spreadsheet as a child spreadsheet: drop-down menu (Figure 5)
- Select OK
| Numbered figure captions | ||||
|---|---|---|---|---|
| ||||
|
- Select () from the quick action bar to save the filtered spreadsheet
- Specify a name for the spreadsheet, we chose autosomal, using the Save File dialog
- Select Save to save the spreadsheet
It is best practice to occasionally save the project you are working on. Let's take the opportunity to do this now.
- Select File from the main command toolbar
- Select Save Project...
- Specify a name for the project, we chose Methylation, using the Save File dialog
- Select Save to save the project
Saving the project saves the identity and child-parent relationships of all spreadsheets displayed in the spreadsheet tree. This allows us to open all relevant spreadsheets for our analysis by selecting the project file.
| Page Turner | ||
|---|---|---|
|
| Additional assistance |
|---|
|
| Rate Macro | ||
|---|---|---|
|
Overview
Content Tools