Page History
...
- In the Configuration for “Down Syndrome vs Normal” panel, check that Include size of the change is selected and enter 1.3 into Fold change Change > and -1.3 in OR Fold change Change <
- Select Include significance of the change, choose unadjusted p-value from the dropdown menu, and < 0.001 for the cutoff
...
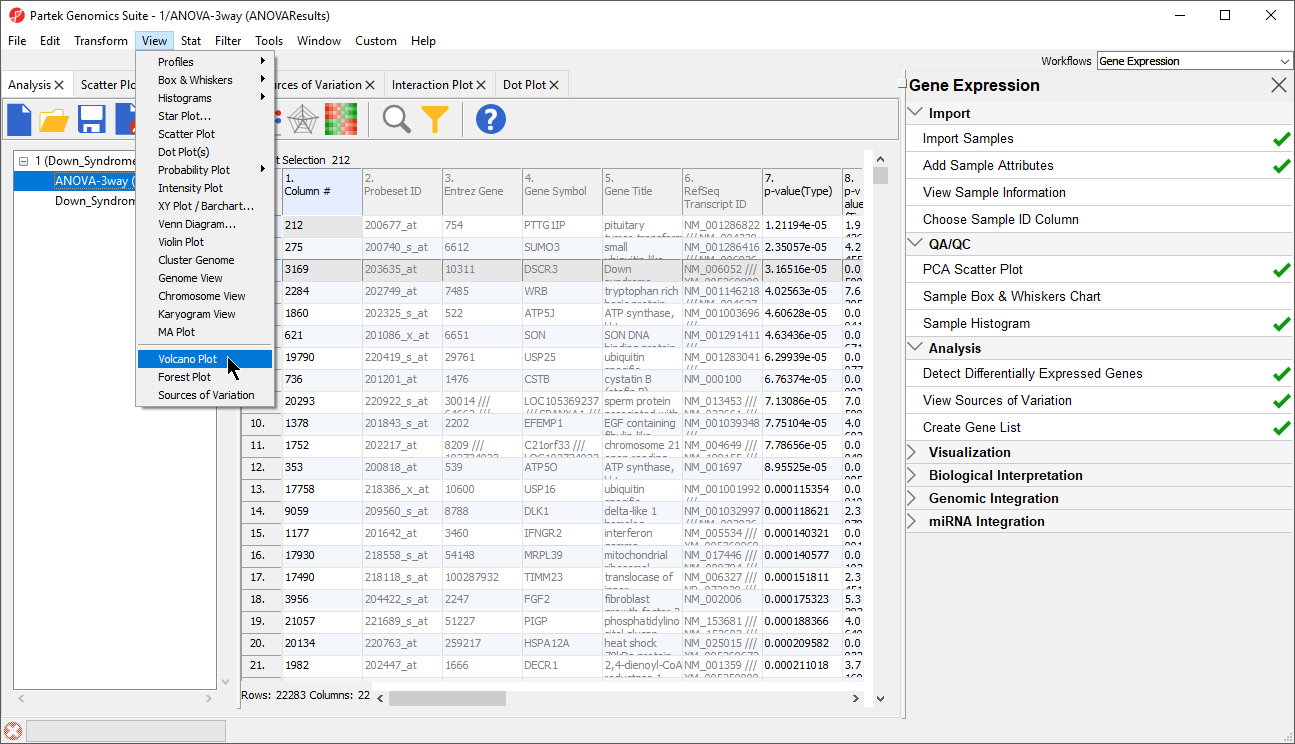
- Select the 1/ANOVA-3way (ANOVAResults) spreadsheet in the Analysis tab. This is the spreadsheet our gene list will be drawn from
- Select View > Volcano Plot from the Partek Genomics Suite main menu (Figure 102)
| Numbered figure captions | ||||
|---|---|---|---|---|
| ||||
|
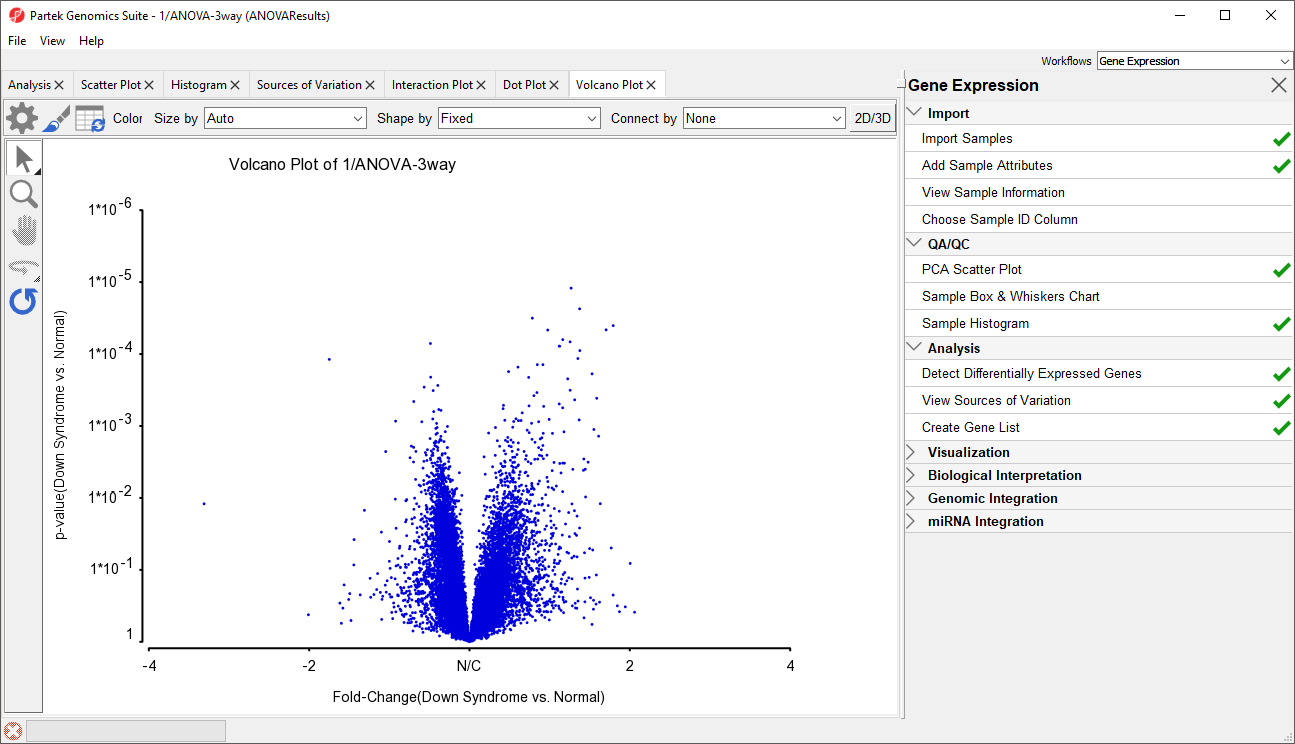
- Set X Axis (Fold-Change) to 12. Fold-Change(Down Syndrome vs. Normal), and the Y axis (p-value) to be 10. p-value(Down Syndrome vs. Normal)
- Select OK to generate a Volcano Plot tab for genes in the ANOVA spreadsheet (Figure 113)
| Numbered figure captions | ||||
|---|---|---|---|---|
| ||||
|
...
- Select Rendering Properties (
 )
) - Choose the Axes tab
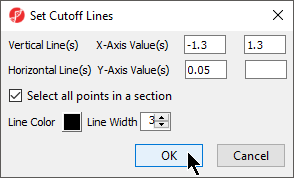
- Check Select all points in a section to allow Partek Genomics Suite to automatically select all the points in any given section
- Select the Set Cutoff Lines button and configure the Set Cutoff Lines dialog as shown (Figure 124)
| Numbered figure captions | ||||
|---|---|---|---|---|
| ||||
|
...
- Right-click on the selected region in the plot and choose Create List to create a list including the genes from the section selected (Figure 135). Note that these p-values are uncorrected
...
The description is shown when you right-click on the spreadsheet > Info > Comments. Here, I have named the list "volcano plot list" and described it as "Genes with >1.3 fold change and p-value <0.05" (Figure 146). The list can be saved as a text file (File > Save As Text File) for use in reports or by downstream analysis software.
...
Overview
Content Tools