Page History
...
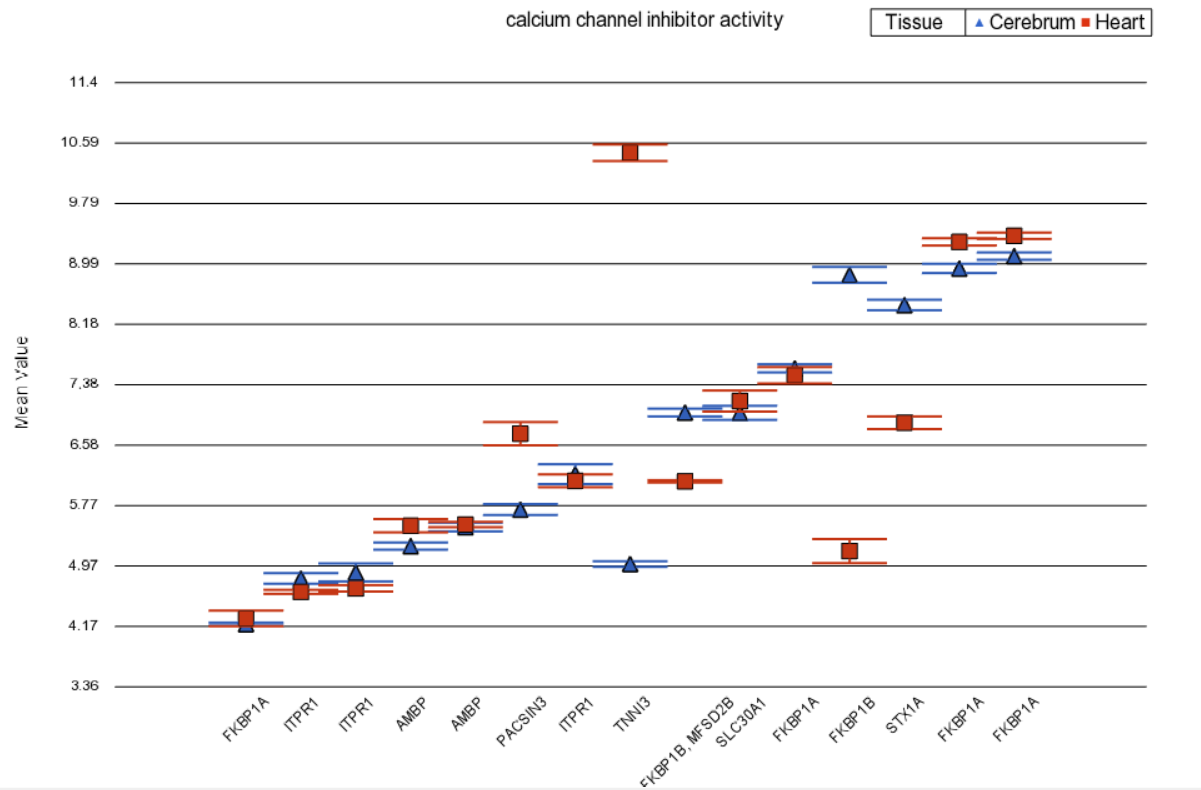
Profile plot on Figure 2 visualizes a GO category without differential expression, but with significant disruption. Note that the gene TNNI3 is up-regulated in the heart, while STX1A is down-regulated in the heart.
| Numbered figure captions | ||||
|---|---|---|---|---|
| ||||
|
...
Overview
Content Tools