Page History
...
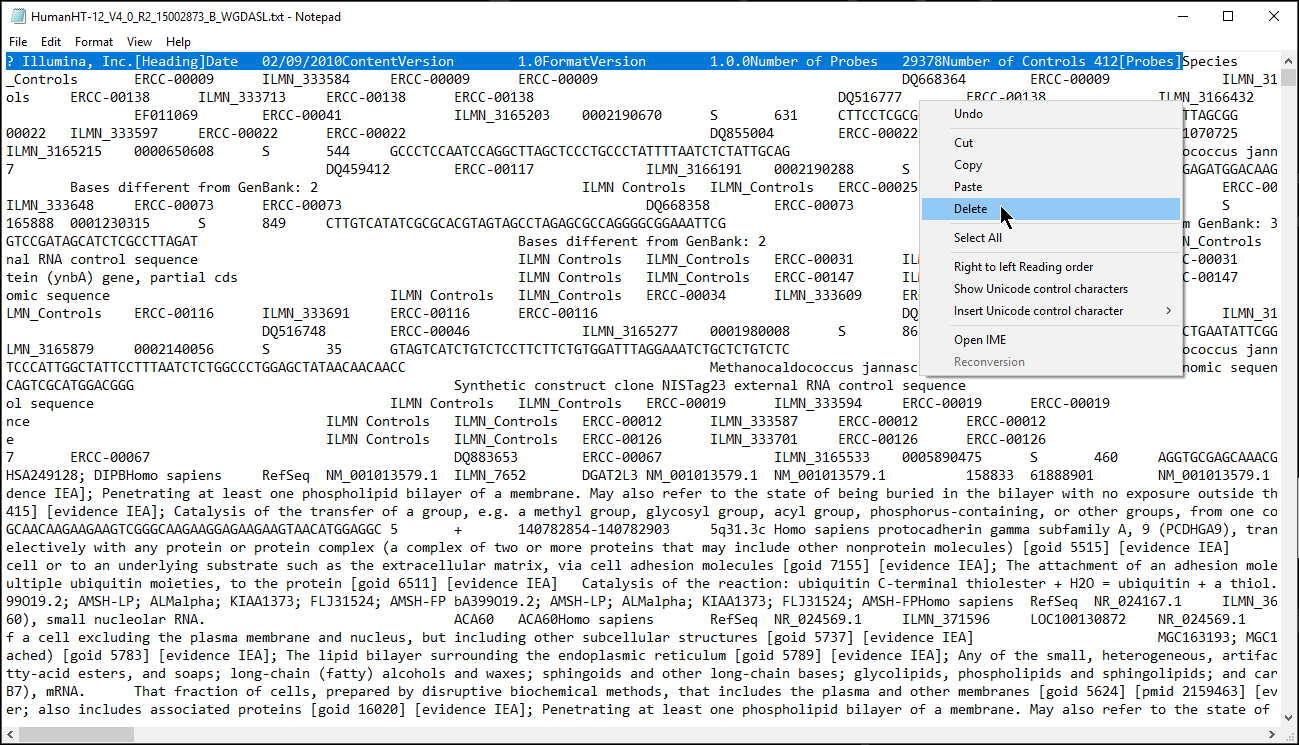
If it is difficult to visualize where the column headers start, it might help to import the annotation file into a spreadsheet viewing program such as Microsoft Excel or Google Sheets.
| Numbered figure captions | ||||
|---|---|---|---|---|
| ||||
|
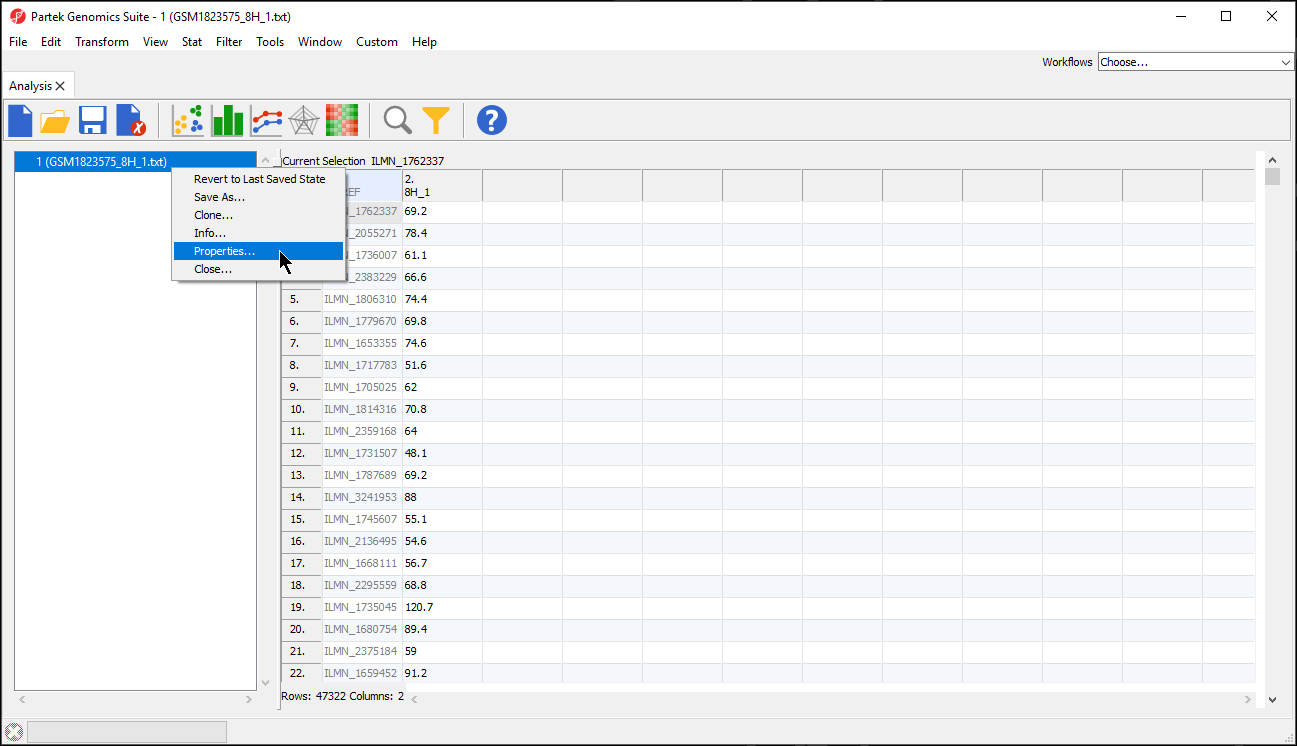
- Right click the spreadsheet you want to annotate in the spreadsheet tree panel
- Select Properties from the pop-up menu (Figure 2)
| Numbered figure captions | ||||
|---|---|---|---|---|
| ||||
|
Depending on how you imported the data, you may see a Configure Spreadsheet dialog (Figure 3). Select the most appropriate option for your data; here we have chosen Genomic microarray.
...
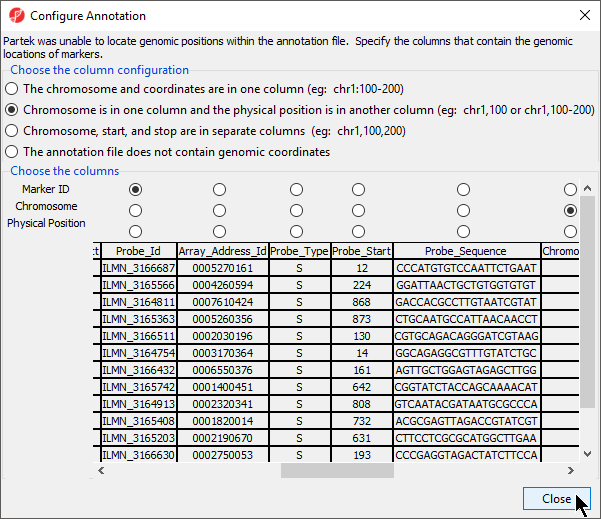
- Select Close to return to the Configure Genomic Properties
| Numbered figure captions | ||||
|---|---|---|---|---|
| ||||
|
The Chip/Reference text field will be populated with the annotation file name. You can edit this text field this if you wish.
- Select the species and genome from the Species and Genome Build section of the dialog; we have chosen Homo sapiens and hg19 (Figure 4)
| Numbered figure captions | ||||
|---|---|---|---|---|
| ||||
|
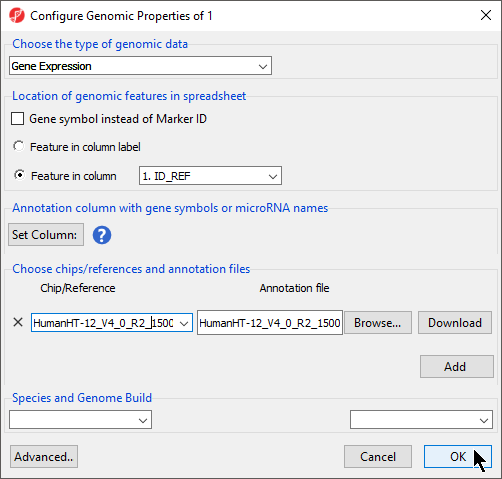
- Select OK apply the annotation file to your data spreadsheet
...
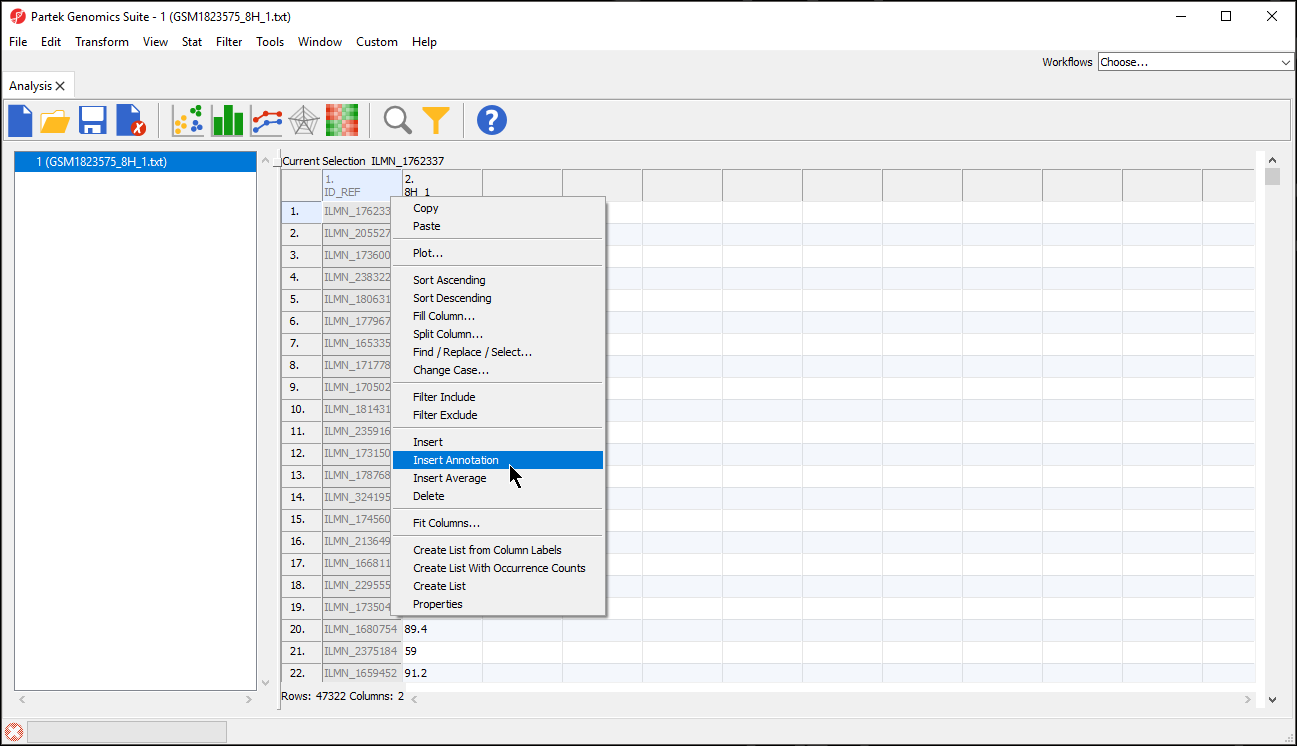
- Right-click on a column in the annotated data file spreadsheet
- Select Insert Annotation from the pop-up menu (Figure 5)
| Numbered figure captions | ||||
|---|---|---|---|---|
| ||||
|
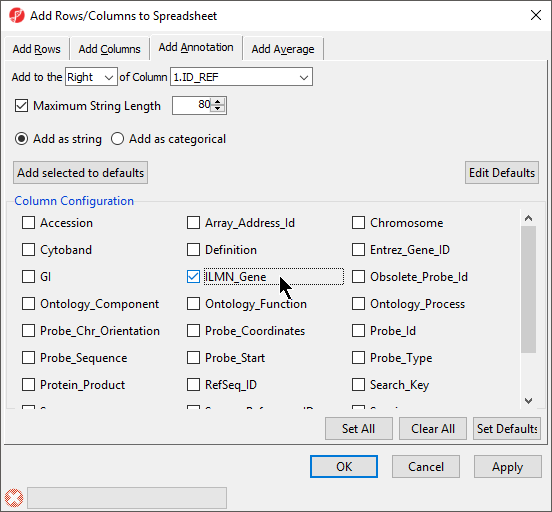
The Column Configuration section of the Add Rows/Columns to Spreadsheet dialog should contain all the feature annotations from the annotation file spreadsheet (Figure 6). Here we selected ILMN_Gene, which will add gene name information as a column next to 1. ID_REF.
| Numbered figure captions | ||||
|---|---|---|---|---|
| ||||
|
Annotation features can also be added to the Genome Viewer as tracks. See (chapter on genome viewer) for an introduction to adding tracks.
...
Overview
Content Tools