Associating a Spreadsheet with an Annotation File
For Partek Genomics Suite to recognize an annotation spreadsheet, it must meet several requirements. First, there must be a column header row in the annotation file. Second, there must be a column in the annotation file that matches the identifiers in your data spreadsheet. Third, any text field above the column header row must start with #. Fourth, the text fields must be tab or comma delimited.
We will illustrate associating a spreadsheet with an annotation file using an imported .txt data file from an Illumina HumanHT-12 v4.0 Gene Expression BeadChip array and the HumanHT-12 v4.0 Whole-Genome Manifest File (TXT Format) from Illumina.
- Open the annotation file with a text editor such as Notepad++/WordPad/TextEdit (Microsoft Excel is not recommended to edit text files, for instance when used default settings, it converts gene names to dates and floating-point numbers)
Microsoft Excel is not recommended for viewing text files because on default settings it converts some gene names to dates and others to floating-point numbers
- Verify that a column in the annotation file matches the identifier in your data spreadsheet, e.g probe ID, the identifier must be unique to each row
- Remove the text before the first column header (Figure 1) or add # to each text box
- Save the annotation file as a .txt file
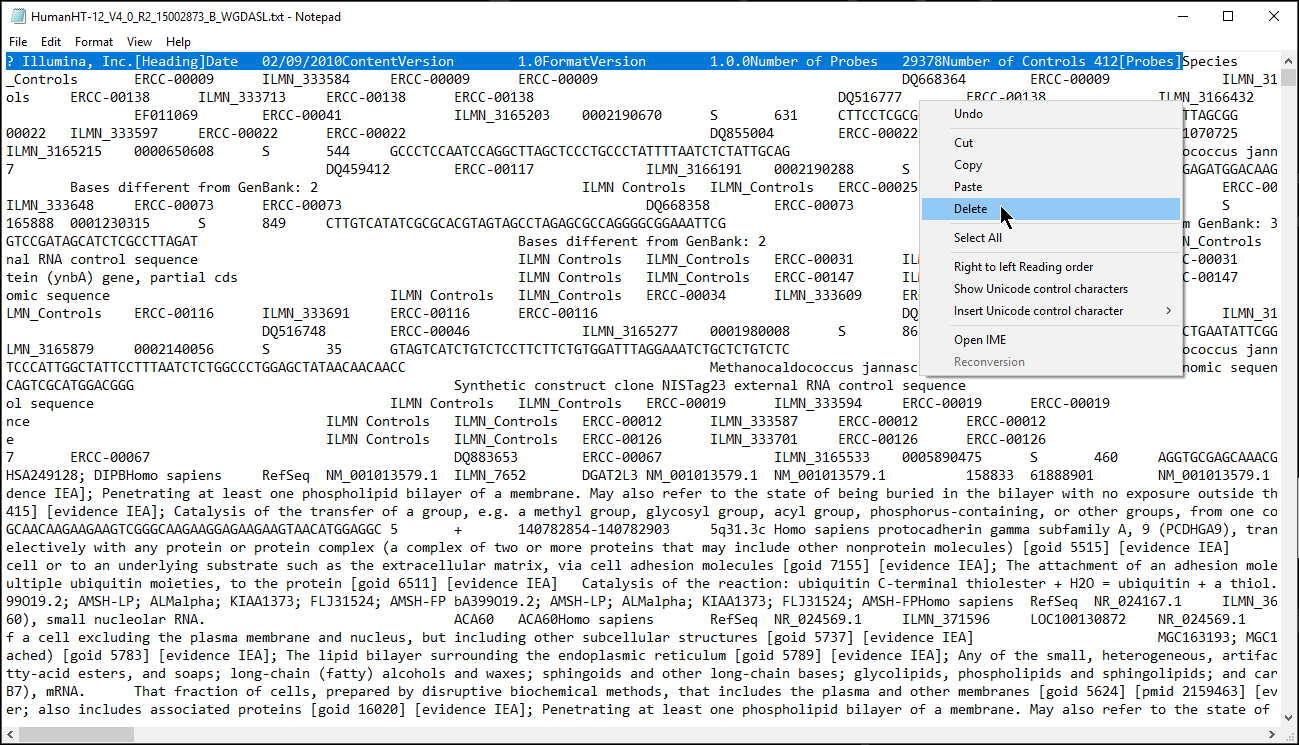
Figure 1. The HumanHT-12 v4.0 Gene Expression BeadChip annotation file contains several rows of information prior to the column header row. To use this annotation file in Partek Genomics Suite, we delete any rows prior to the column headers row.
- Right-click the spreadsheet you want to annotate in the spreadsheet tree panel, select Properties from the pop-up menu (Figure 2) or select Properties from the File menu on the main toolbar
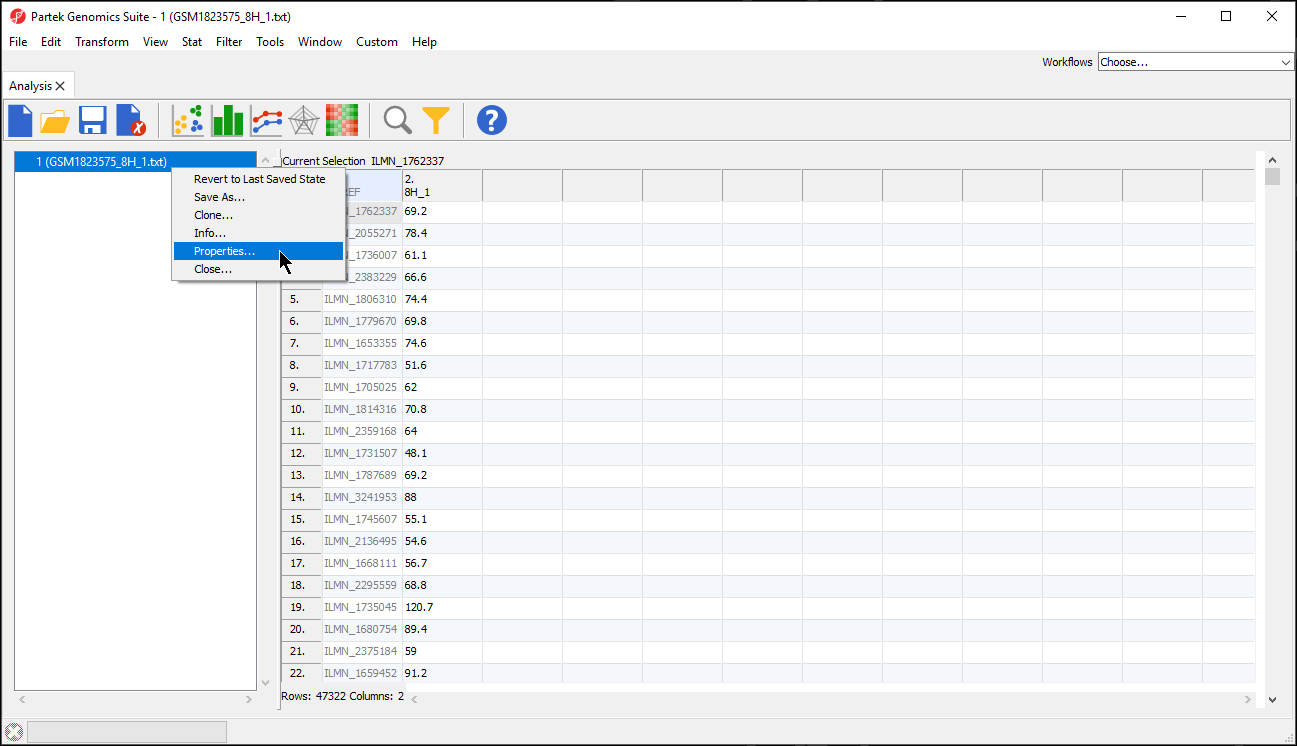
Figure 2. Changing the spreadsheet properties
Depending on how you imported the data, you may see a Configure Spreadsheet dialog (Figure 3). Select the most appropriate option for your data; here we have chosen Genomic microarray.
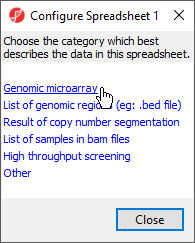
Figure 3. The Configure Spreadsheet dialog may appear depending on how you imported your data
The Configure Genomic Properties dialog will now open.
- Select the appropriate option for Choose the type of genomic data; here we have chosen Gene Expression (Figure 4).
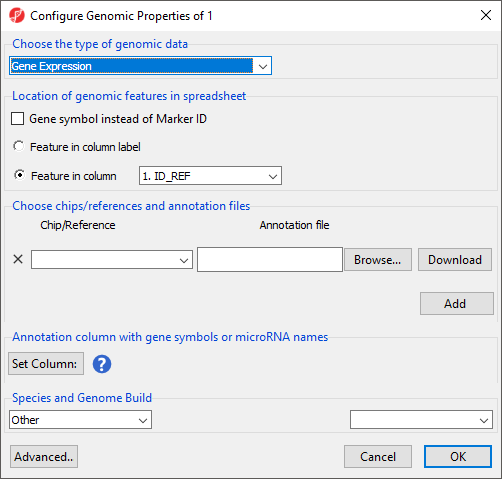
Figure 4. Selecting the type of genomic data
- Select the appropriate options for Location of genomic features in spreadsheet
Selecting Gene Symbol instead of Marker ID allows biological interpretation tasks like GO Enrichment or Pathway Enrichment to be performed without an annotation file because the gene symbol can be used to look up the gene set or pathway database.
Location of genomic features in spreadsheet allows you to specify whether genomic features (e.g. genes, miRNAs, probes, SNPs, CpGs etc) are represented by columns or rows. For Feature in column label, each feature is on a column, each row is a sample. For Feature in column, each feature is on a row and the feature ID for each feature is located in the column chosen with the drop-down menu.
Choose chips/reference and annotation files allows you to specify an annotation file to associate with the spreadsheet.
- Select Browse... from Choose chips/references and annotation files
- Select your annotation spreadsheet file using the file selection interface
If the genomic position information from the annotation file cannot be automatically parsed, the Configure Annotation dialog will launch. This dialog allows you to choose which columns in the annotation file give the identity and genomic location of the features in your data spreadsheet. There are four options depending on if and how chromosome coordinates are described in the annotation file.
- Select the appropriate option for your annotation file; we have selected Chromosome is in one column and the physical position is in another column (eg: chr1, 100 or chr1, 100-200)
The Choose the columns section displays the annotation file spreadsheet with options to choose which columns are the Marker ID,Chromosome, and Physical Position (Figure 4).
- Select the column that matches the feature IDs in your data spreadsheet for Marker ID; we have chosen Probe_Id for Marker ID.
- Select the column(s) that matches the chromosome location data; we have chosen Chromosome for Chromosome and Probe_Coordinates for Physical Position.
- Select Close to return to the Configure Genomic Properties
An index file for the genomic location data of the annotation file is generated in the same folder as the annotation file; it has the same file name as the annotation file, but the file extension .idx. If you need to re-configure the genomic location field in the annotation file, first manually delete the .idx file and re-do the above steps to generate a new index file for the annotation file.
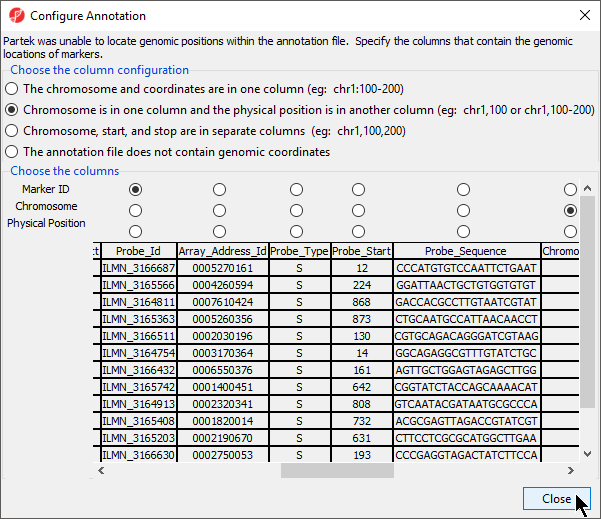
Figure 5. Specifying the columns that contain the genomic locations of markers in the annotation file
The Chip/Reference text field will be populated with the annotation file name. You can edit this text field this if you wish.
For the Annotation column with gene symbols or miRNA names section, if Gene symbol instead of Marker ID is selected, this field is used automatically populated with the gene symbol column; however, if it is not selected, you will need to manually specify the column in the annotation file that corresponds with gene symbols or miRNA names.
- Select Set Column:
Select the appropriate column from the dialog; here we have selected ILMN_gene (Figure 5)
Select OK
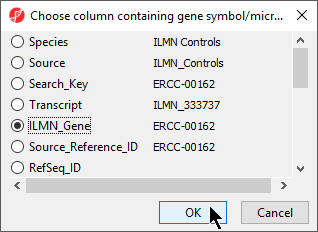
Figure 6. Choosing the annotation column with gene symbols
Species and gene symbol information is required for biological interpretation analysis.
- Select the correct species and genome build from the drop-down menus; we have chosen Homo sapiens and hg19 (Figure 6)
- Select OK apply the annotation file to your data spreadsheet
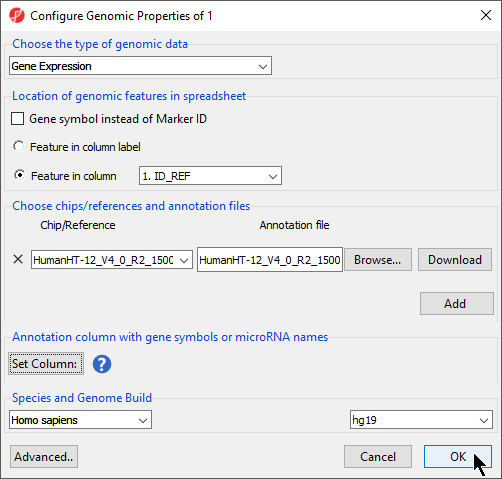
Figure 7. Choosing annotation file using the Configure Genomic Properties dialog
To verify that the annotation has been added, we can try to add annotation information to the spreadsheet when the feature are on rows in the spreadsheet.
- Right-click on a column in the annotated data file spreadsheet
- Select Insert Annotation from the pop-up menu (Figure 5)
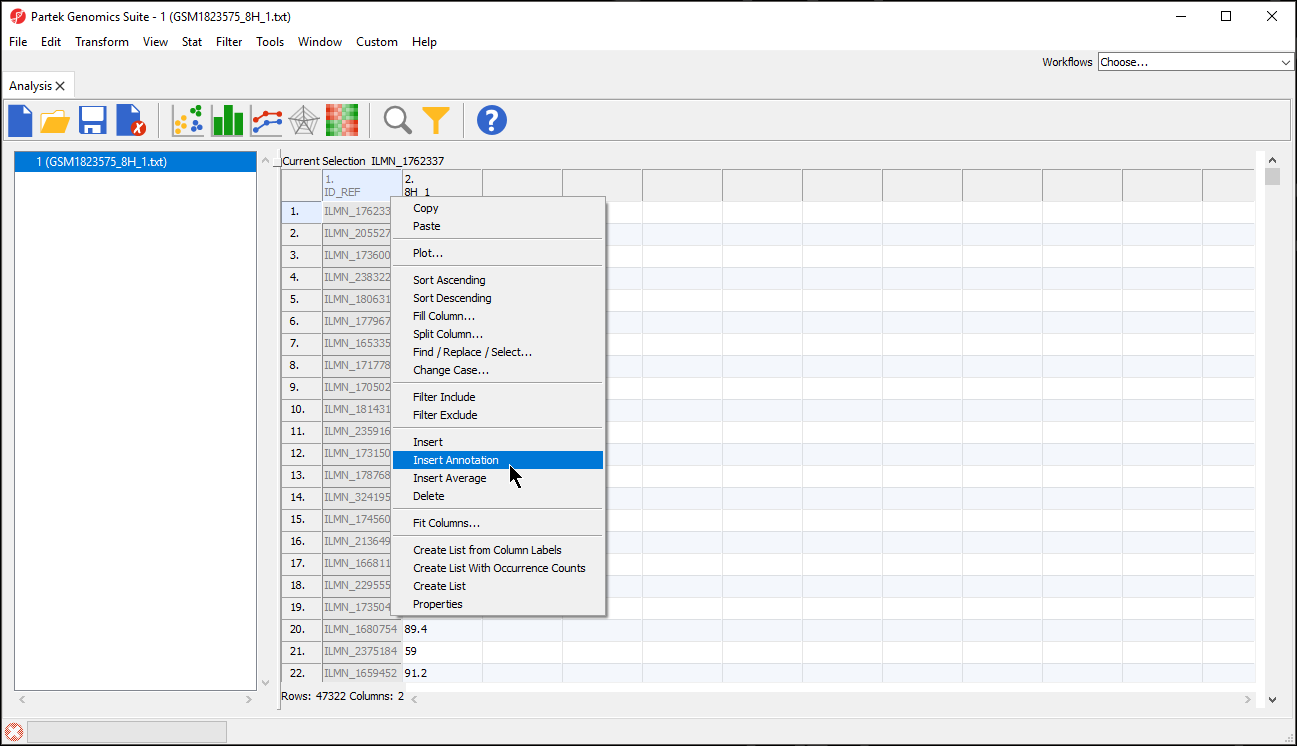
Figure 8. Adding an annotation column to data spreadsheet
The Column Configuration section of the Add Rows/Columns to Spreadsheet dialog should contain all the feature annotations from the annotation file spreadsheet (Figure 6). Here we selected ILMN_Gene, which will add gene name information as a column next to 1. ID_REF.
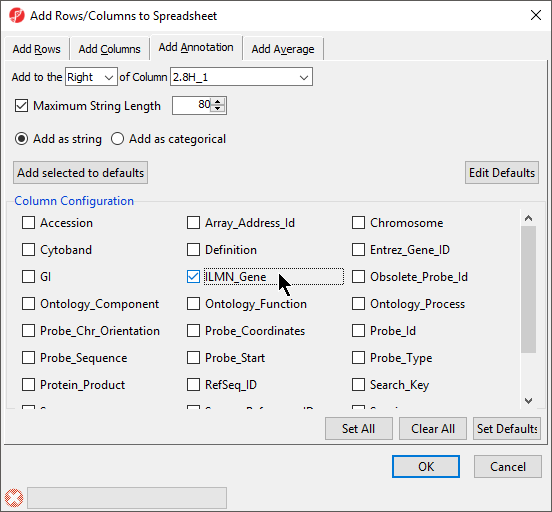
Figure 9. Annotations from the annotation spreadsheet file should appear as options in the Column Configuration section of the Add Rows/Columns to Spreadsheet
Building an Annotation File
Annotation files for most commercial arrays are available from the chip manufacturer. If you have a custom chip or want to use a customized annotation file, you can create an annotation file that will allow you to add annotations to your features (e.g. probe IDs) when the features are represented by rows on the spreadsheet. Your annotation file must meet the following criteria:
- The annotation file must have a column header with a label for each column
- A column in the annotation file must correspond to the feature ID column of your data spreadsheet
- Any comments before the header must start with # or the header will not be recognized
- The fields of the annotation file must be tab or comma delimited
To invoke a genome view of your data, your annotation file must also have one or more columns that contain the genomic location in a format that Partek Genomics Suite can recognize. The annotation file must also contain a column that has the chromosome and base pair location (start and stop or physical position). Cytoband and/or strand can also be included.
The table below provides possible column labels, a description of the format for that field, and an example.
| Column label | Description of format | Example |
|---|---|---|
| chromosome | a chromosome label | 3 |
| start | an integer, the start position (in base pairs) of the feature | 69871322 |
| stop | an integer, the stop position (in base pairs) of the feature | 70100176 |
| genomic_coordinates | chromosome:start-stop | 3:69871322-70100176 |
| strand | + for top, - for bottom | + |
| physical position | an integer, the position (in base pairs) of the feature | 70100176 |
Here are a few examples of the first two rows of annotation files:
- Using Agilent format
| ProbeID | GeneName | GenomicCoordinates | Cytoband |
|---|---|---|---|
| A_44_P1025812 | TC521361 | chr12:2546883-2546824 | rn|12p12 |
- Using Affymetrix SNPs format
| Probe Set ID | Chromosome | Physical Position | Strand | Cytoband |
|---|---|---|---|---|
| SNP_A-1512540 | 9 | 22205296 | - | p21.3 |
- Using Affymetrix exons format
| probeset_id | seqname | strand | start | stop |
|---|---|---|---|---|
| 2315588 | chr1 | + | 1155398 | 1155624 |
Additional Assistance
If you need additional assistance, please visit our support page to submit a help ticket or find phone numbers for regional support.


| Your Rating: |
|
Results: |

|
38 | rates |
Overview
Content Tools