Join us for a webinar: The complexities of spatial multiomics unraveled
May 2
Page History
...
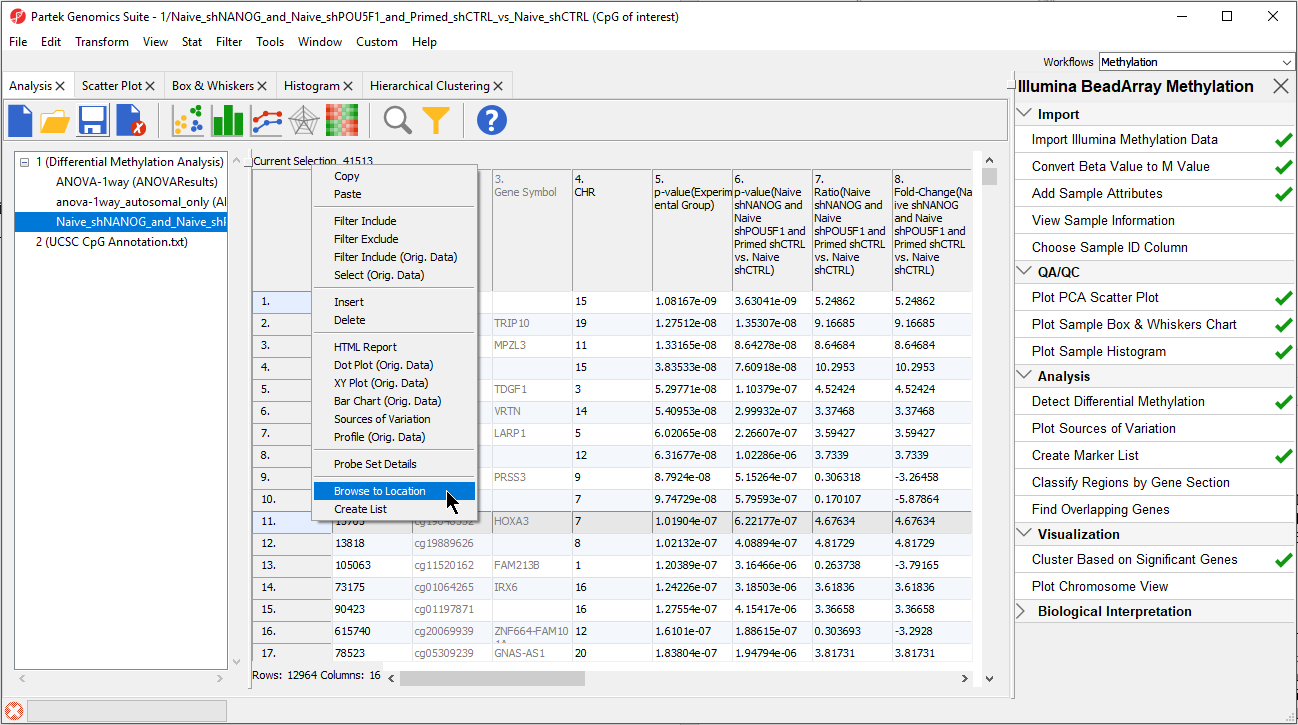
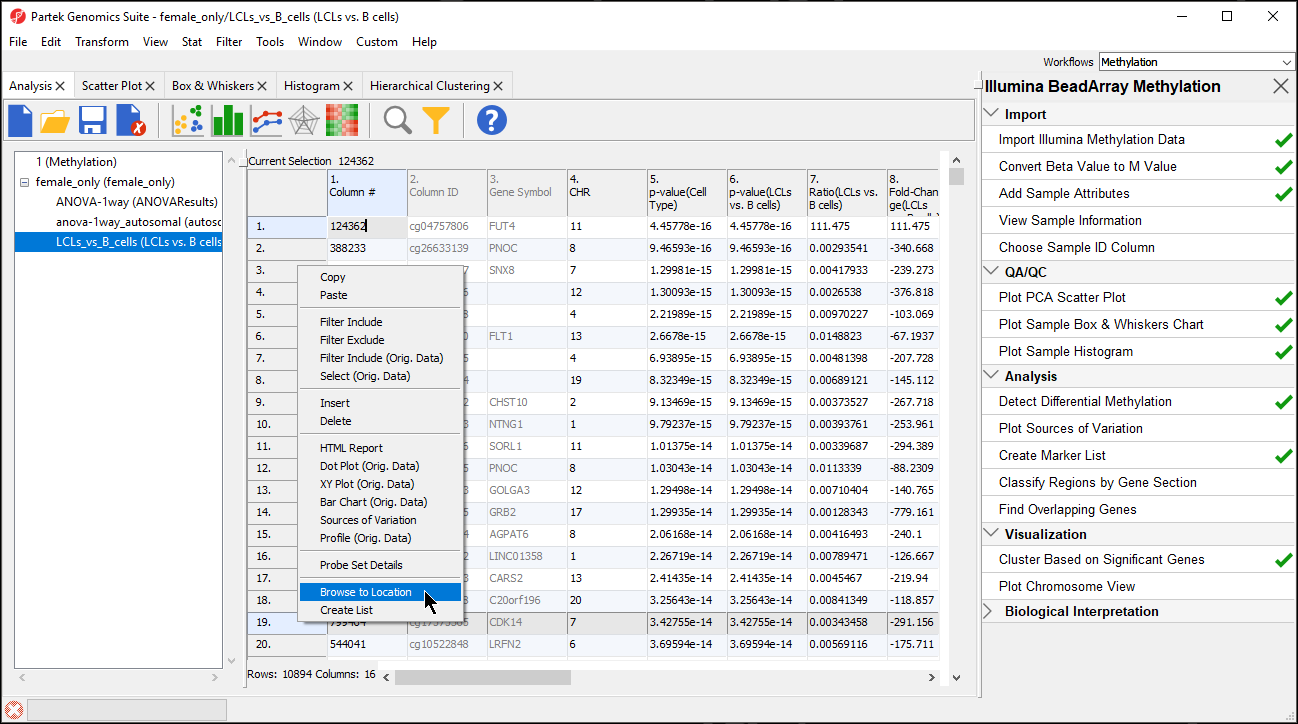
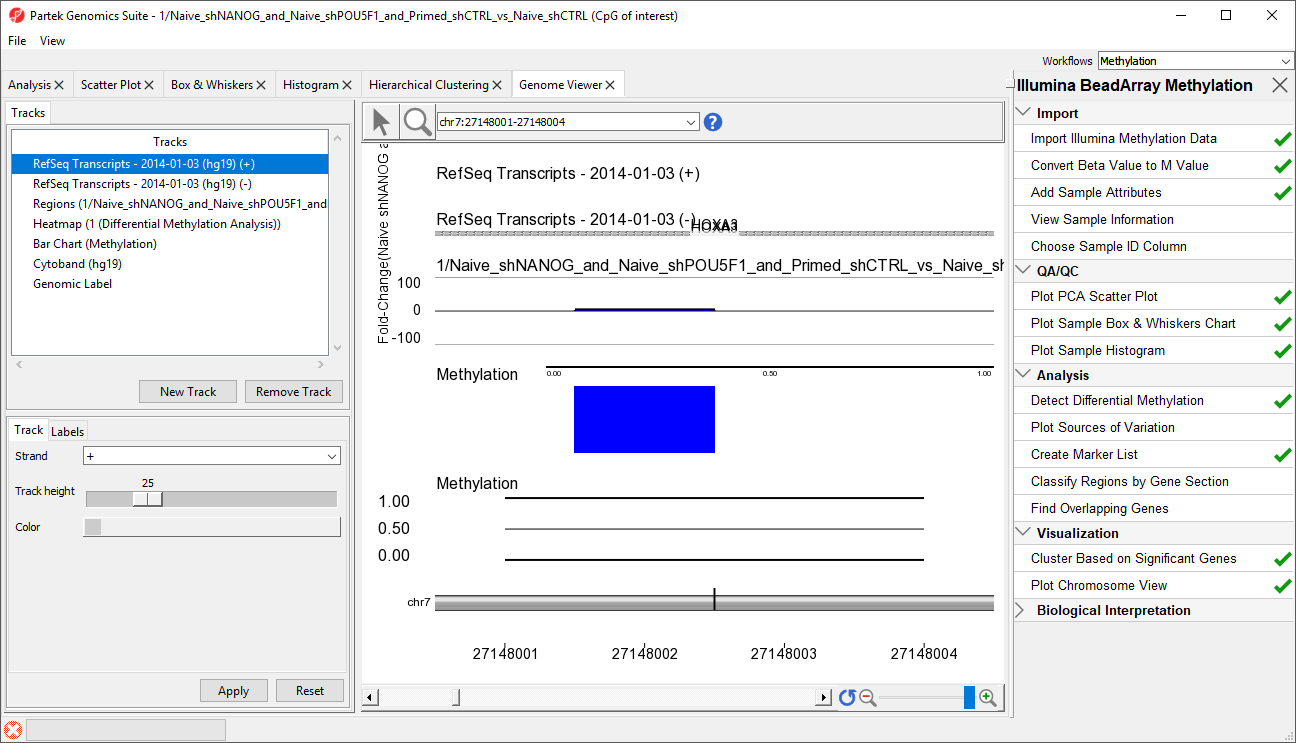
Partek Genomics Suite enables you to visualize each probe and compare the methylation between the groups at a single CpG site level. The visualization can be supplemented with a special annotation file which can be built using a UCSC annotation file as the basis.
| Numbered figure captions | ||||
|---|---|---|---|---|
| ||||
|
| Numbered figure captions | ||||
|---|---|---|---|---|
| ||||
|
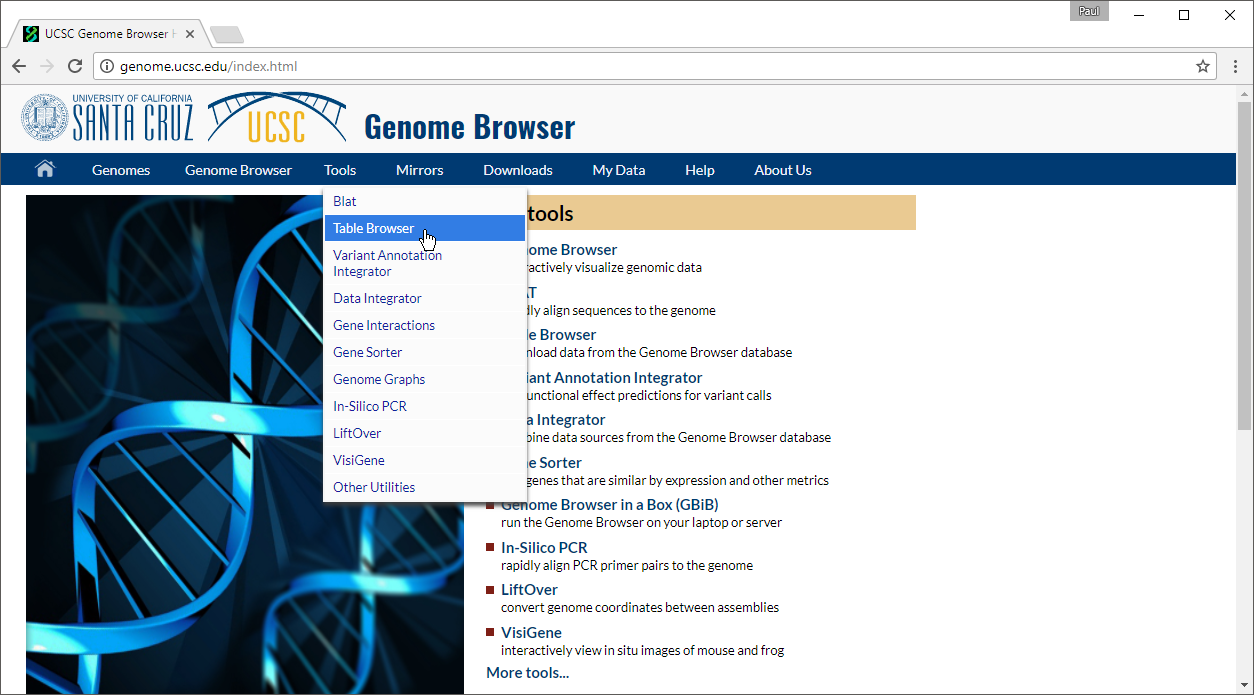
Adding UCSC CpG Annotations
...
| Numbered figure captions | ||||
|---|---|---|---|---|
| ||||
|
...
| Numbered figure captions | ||||
|---|---|---|---|---|
| ||||
|
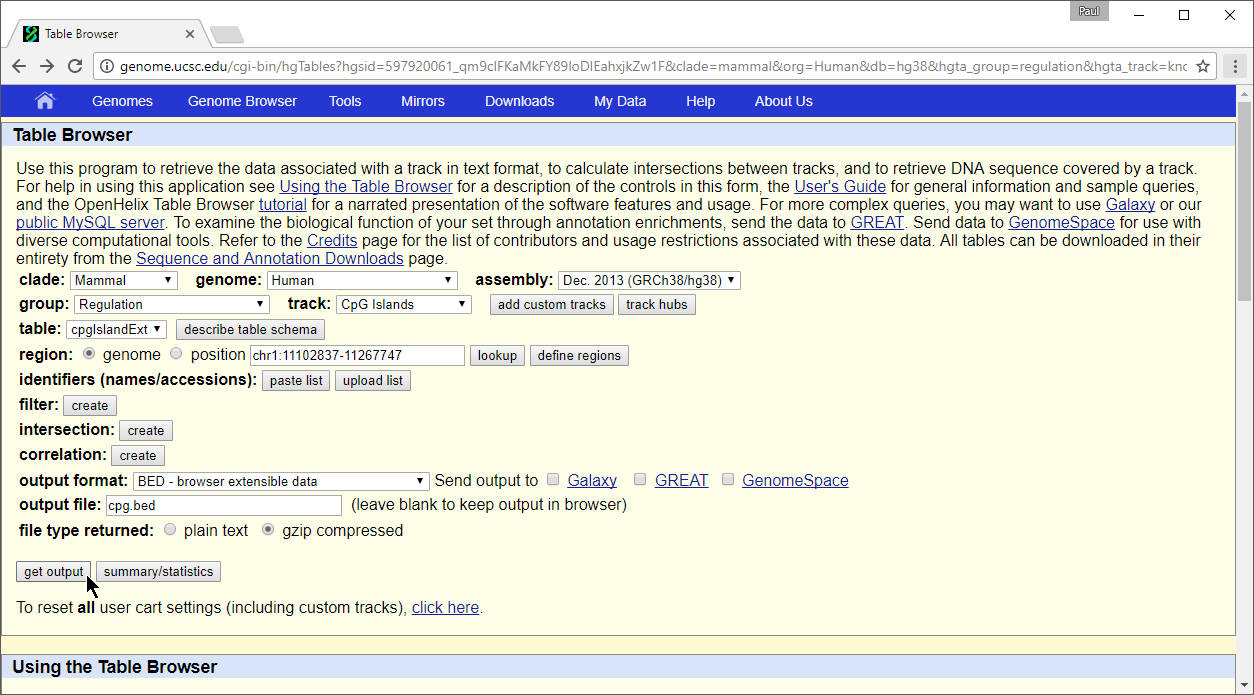
- Set group to Regulation
- Set track to CpG Islands
- Set table to cpgIslandExt
- Set output format to BED
- Set output file to cpg.bed
- Select get output
The Output cpgIslandExt as BED page will open.
- Select get BED to download a compressed folder containing the BED file
- Unzip the file using 7-Zip, WinRAR, or a similar program of your choice to a location you will be able to find
Next, we can import the BED file into Partek Genomics Suite.
...
| Numbered figure captions | ||||
|---|---|---|---|---|
| ||||
|
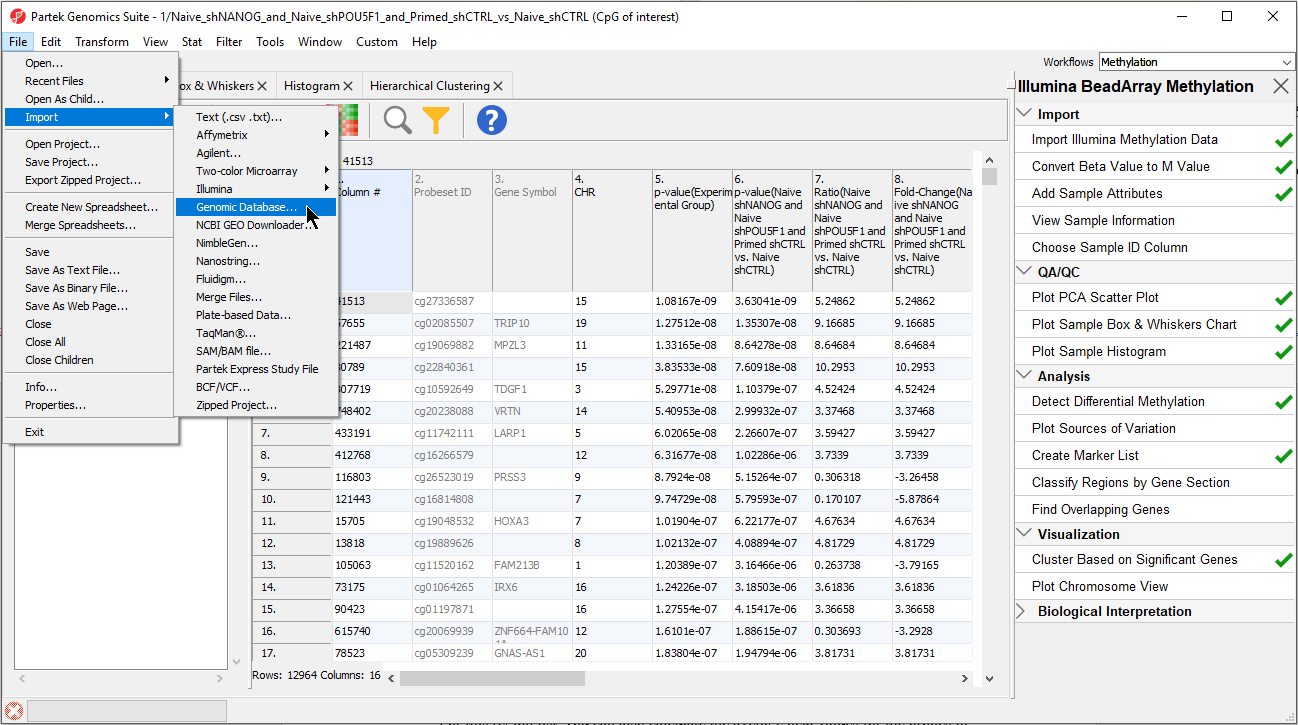
- Select the file cpg.bed
The BED file will open as a new spreadsheet (Figure 5).
- Change the spreadsheet name to UCSC CpG Island Annotation and save it
For this region list, you can also calculate the average beta values for the probes in each island per sample and detect differential methylated CpG islands regions. Detailed information on how to get average beta value for each CpG can be found from the Determining the average values for a region list section of Help>On-line Tutorials>User Guides> List. The visualization can be supplemented with a special annotation file which can be built using a UCSC annotation file as the basis. Building and viewing the UCSC annotation file is available as an optional section of the tutorial, Optional: Adding UCSC CpG Island Annotations.
| Additional assistance |
|---|
|
| Rate Macro | ||
|---|---|---|
|
Overview
Content Tools