Page History
...
| Numbered figure captions | ||||
|---|---|---|---|---|
| ||||
|
The yellow and black bar on the right-hand side of the spreadsheet panel shows the fraction of excluded cells in black and included cells in yellow. Right-clicking this bar brings up an option to clear the filter.
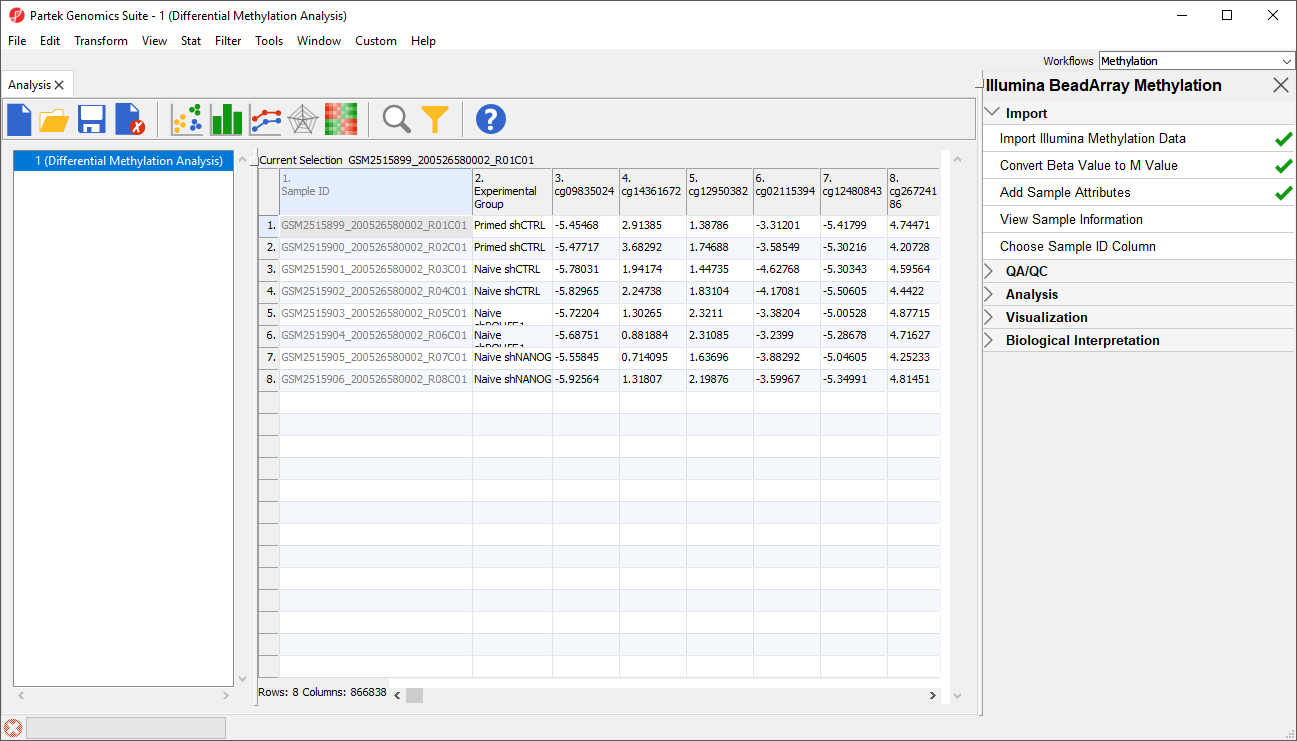
Now that we have filtered out probes on the X and Y chromosomes, we will create a spreadsheet containing only probes on the autosomes.
- Right click on the ANOVA-1way (ANOVAResults) spreadsheet in the spreadsheet tree panel (Figure 4)
| Page Turner | ||
|---|---|---|
|
...
Overview
Content Tools