Page History
...
| Numbered figure captions | ||||
|---|---|---|---|---|
| ||||
|
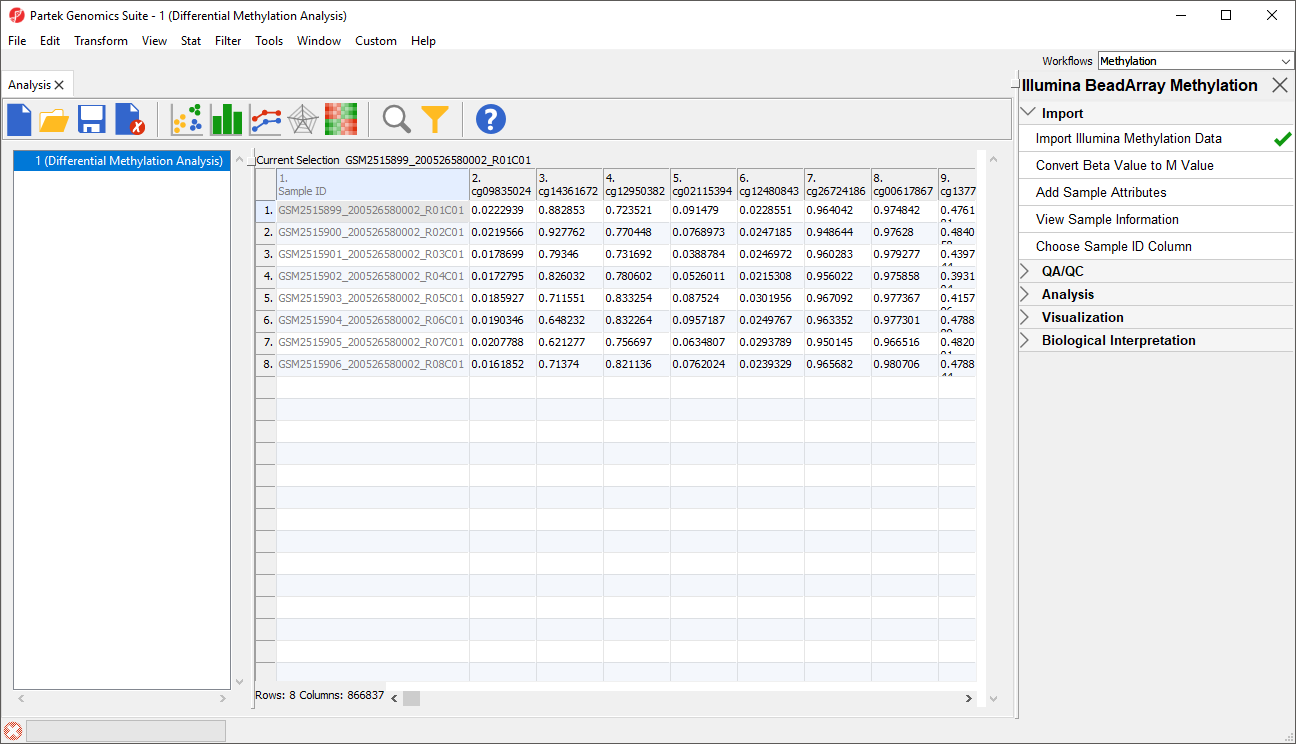
An alternative metric for measurement of methlyation levels are M-values. β-values can be easily converted to M-values using the following equation:
...
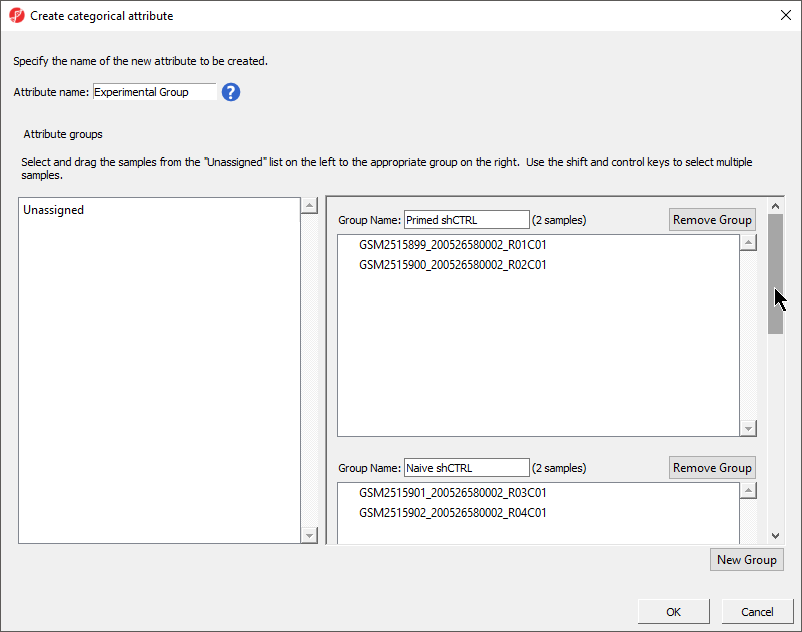
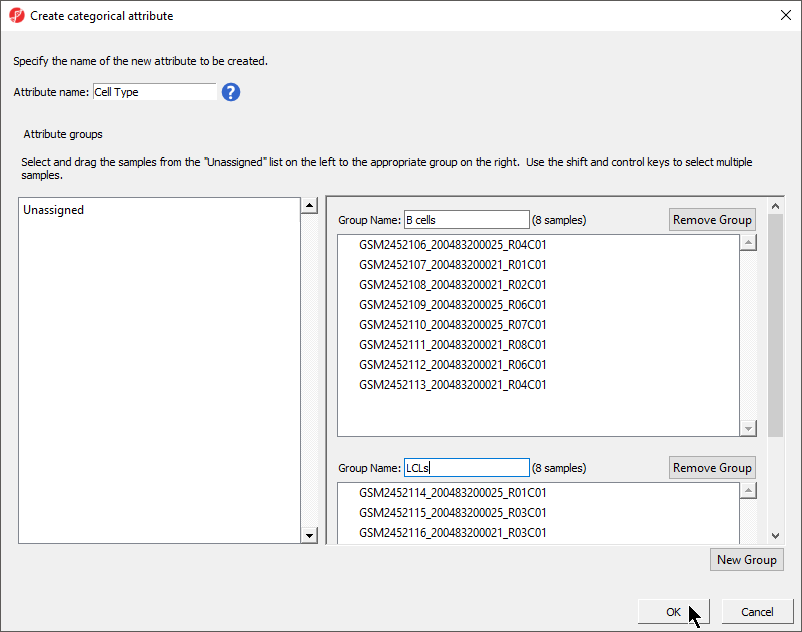
The Create categorical attribute dialog allows us to create groups for a categorical attribute. By default, two groups are created, but additional groups can be added.
- Set Attribute name: to Experimental Group
- Select New Group twice to add two additional groups
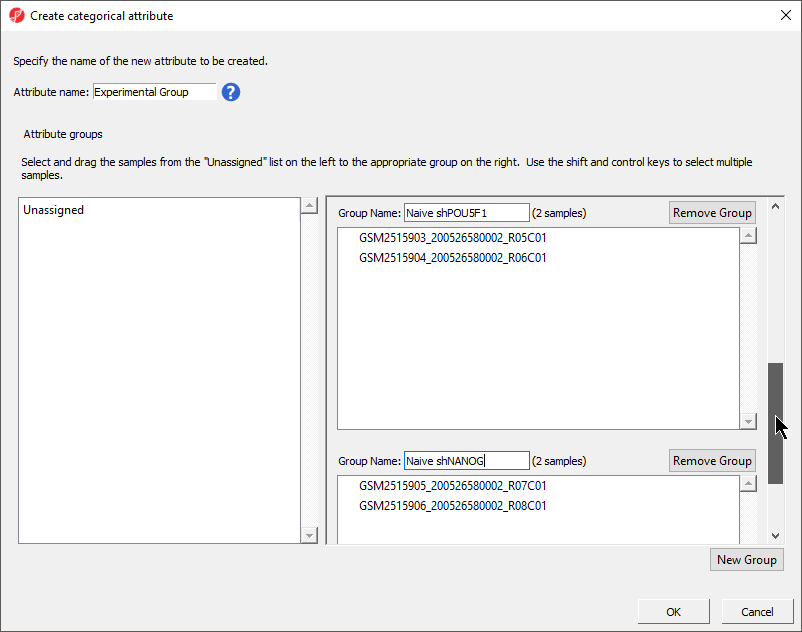
- Rename the groups Primed+shCTRL, Naive+shCTRL, Naive+shPOU5F1, and Naive+shNANOGCell Type
- Rename the groups B cells and LCLs
- Drag and drop the samples from the Unassigned list to their groups as listed in the table below
| Sample ID | Group NameCell Type |
|---|---|
| GSM2515899GSM2452106_200526580002_R01C01 | Primed shCTRL |
| GSM2515900_200526580002_R02C01 | Primed shCTRL |
| GSM2515901_200526580002_R03C01 | Naive shCTRL |
| GSM2515902_200526580002_R04C01 | Naive shCTRL |
| GSM2515903_200526580002_R05C01 | Naive shPOU5F1 |
| GSM2515904_200526580002_R06C01 | Naive shPOU5F1 |
| GSM2515905_200526580002_R07C01 | Naive shNANOG |
| GSM2515906_200526580002_R08C01 | Naive shNANOG |
...
| 200483200025_R04C01 | B cells |
| GSM2452107_200483200021_R01C01 | B cells |
| GSM2452108_200483200021_R02C01 | B cells |
| GSM2452109_200483200025_R06C01 | B cells |
| GSM2452110_200483200025_R07C01 | B cells |
| GSM2452111_200483200021_R08C01 | B cells |
| GSM2452112_200483200021_R06C01 | B cells |
| GSM2452113_200483200021_R04C01 | B cells |
| GSM2452114_200483200025_R01C01 | LCLs |
| GSM2452115_200483200025_R03C01 | LCLs |
| GSM2452116_200483200021_R03C01 | LCLs |
| GSM2452117_200483200025_R05C01 | LCLs |
| GSM2452118_200483200025_R02C01 | LCLs |
| GSM2452119_200483200021_R07C01 | LCLs |
| GSM2452120_200483200021_R05C01 | LCLs |
| GSM2452121_200483200025_R08C01 | LCLs |
There should now be two groups with eight samples in each group (Figure 3).
...
| Numbered figure captions | ||||
|---|---|---|---|---|
| ||||
|
- Select OK
- Select Yes from the Add another categorical attribute dialog
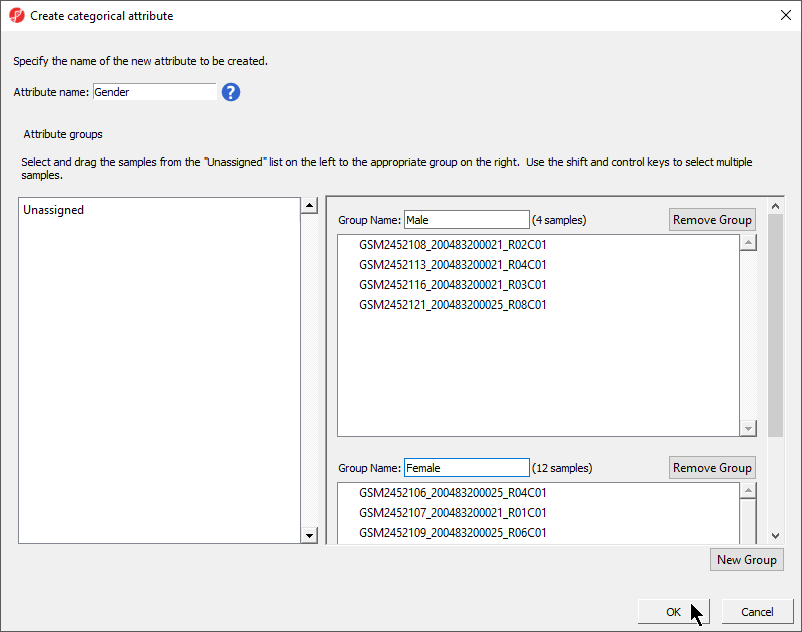
- Set Attribute name: to Gender
- Rename the groups Male and Female
- Drag and drop the samples from the Unassigned list to their groups as listed in the table below
| Sample ID | Gender |
|---|---|
| GSM2452106_200483200025_R04C01 | Female |
| GSM2452107_200483200021_R01C01 | Female |
| GSM2452108_200483200021_R02C01 | Male |
| GSM2452109_200483200025_R06C01 | Female |
| GSM2452110_200483200025_R07C01 | Female |
| GSM2452111_200483200021_R08C01 | Female |
| GSM2452112_200483200021_R06C01 | Female |
| GSM2452113_200483200021_R04C01 | Male |
| GSM2452114_200483200025_R01C01 | Female |
| GSM2452115_200483200025_R03C01 | Female |
| GSM2452116_200483200021_R03C01 | Male |
| GSM2452117_200483200025_R05C01 | Female |
| GSM2452118_200483200025_R02C01 | Female |
| GSM2452119_200483200021_R07C01 | Female |
| GSM2452120_200483200021_R05C01 | Female |
| GSM2452121_200483200025_R08C01 | Male |
There should now be two groups with four samples in Male and twelve samples in Female (Figure 4).
| Numbered figure captions | ||||
|---|---|---|---|---|
| ||||
|
- Select OK
- Select No from the Add another categorical attribute dialog
- Select Yes to save the spreadsheet
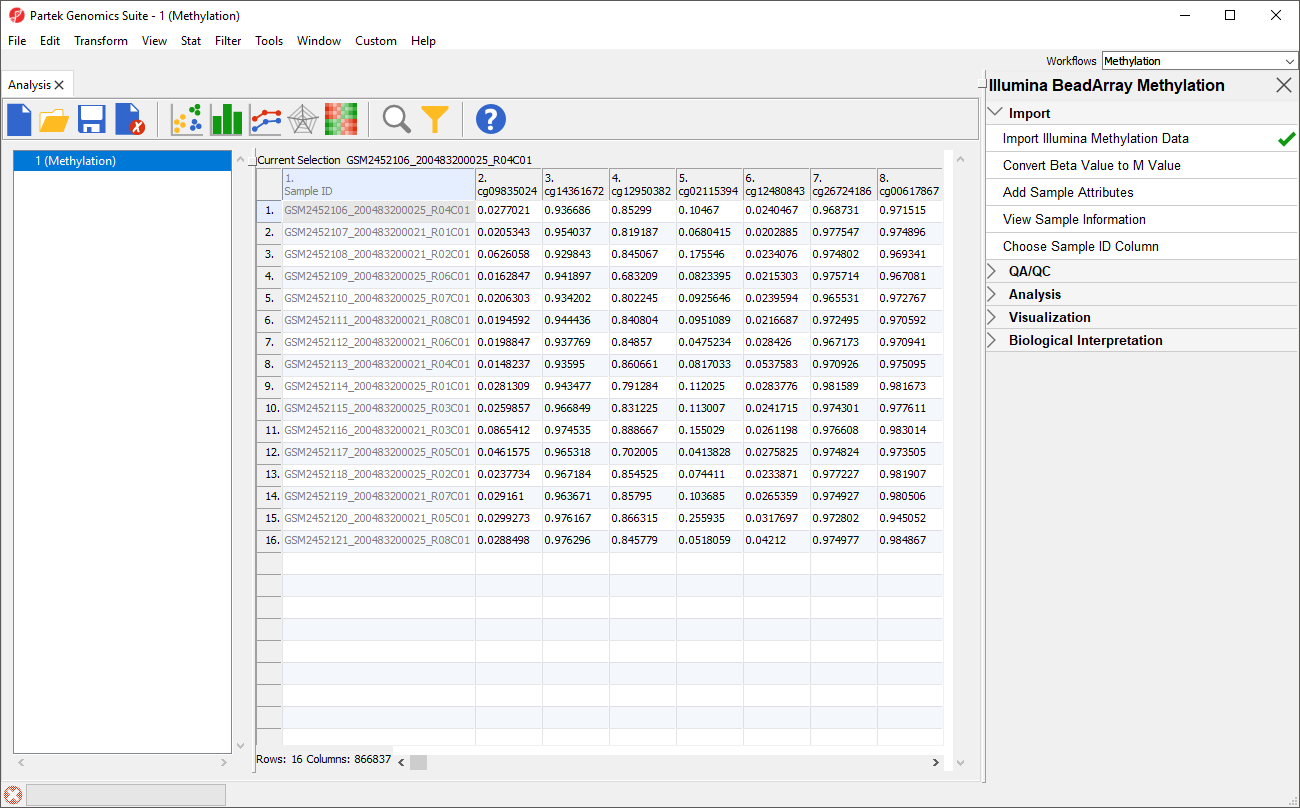
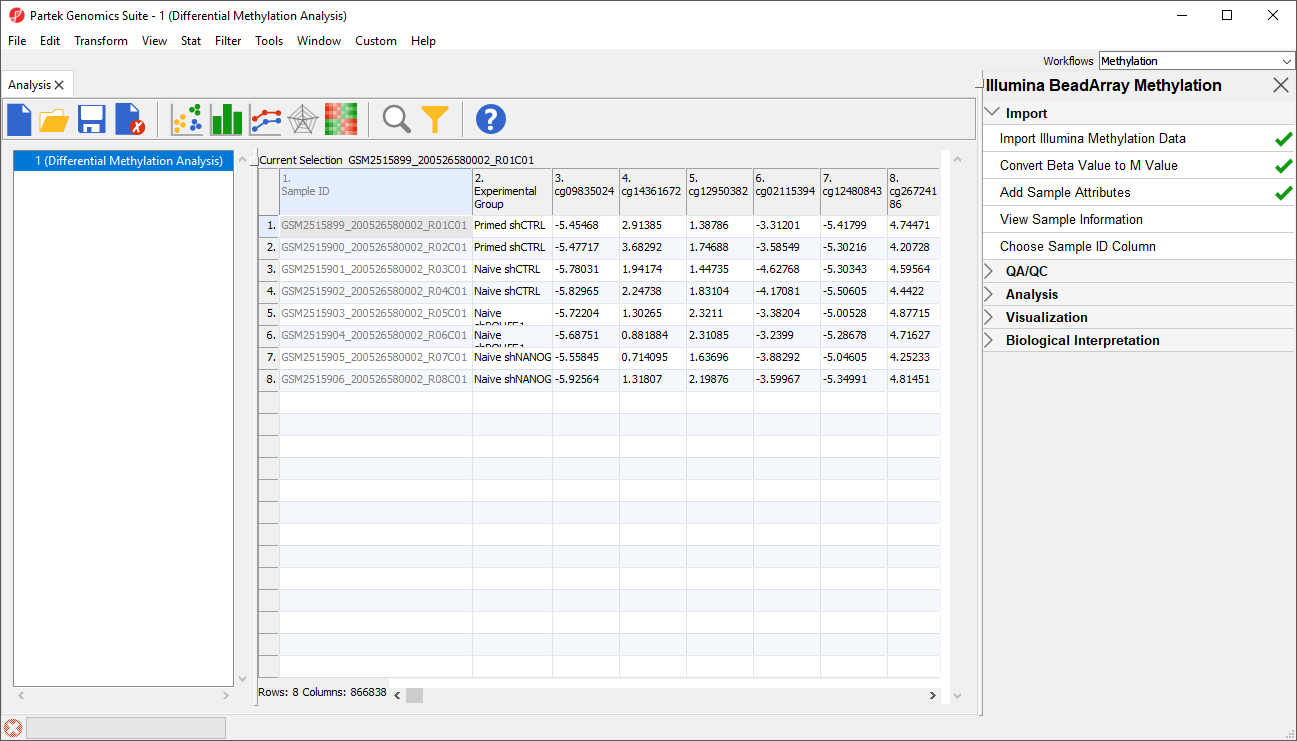
A Two new column has columns have been added to spreadsheet 1 (Differential Methylation Analysis) with the experimental group cell type and gender of each sample (Figure 4).
For this tutorial, we want to exclude all male samples to simplify our analysis. To do this, we can use the interactive filter.
| Numbered figure captions | ||||
|---|---|---|---|---|
| ||||
|
| Page Turner | ||
|---|---|---|
|
...
Overview
Content Tools