Page History
...
| Numbered figure captions | ||||
|---|---|---|---|---|
| ||||
|
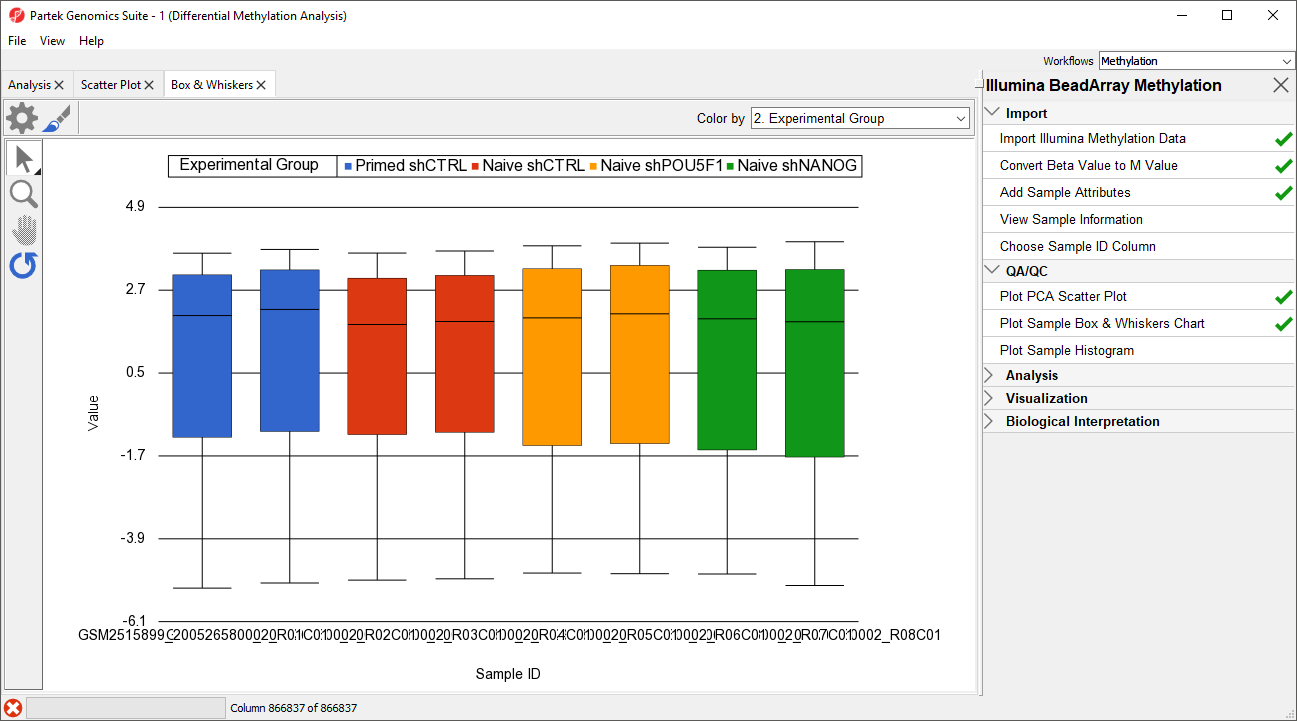
Next, distribution of M-values across the samples can also be inspected by a box-and-whiskers plot.
...
Overview
Content Tools
...
| Numbered figure captions | ||||
|---|---|---|---|---|
| ||||
|
Next, distribution of M-values across the samples can also be inspected by a box-and-whiskers plot.
...