Page History
...
| Numbered figure captions | ||||
|---|---|---|---|---|
| ||||
|
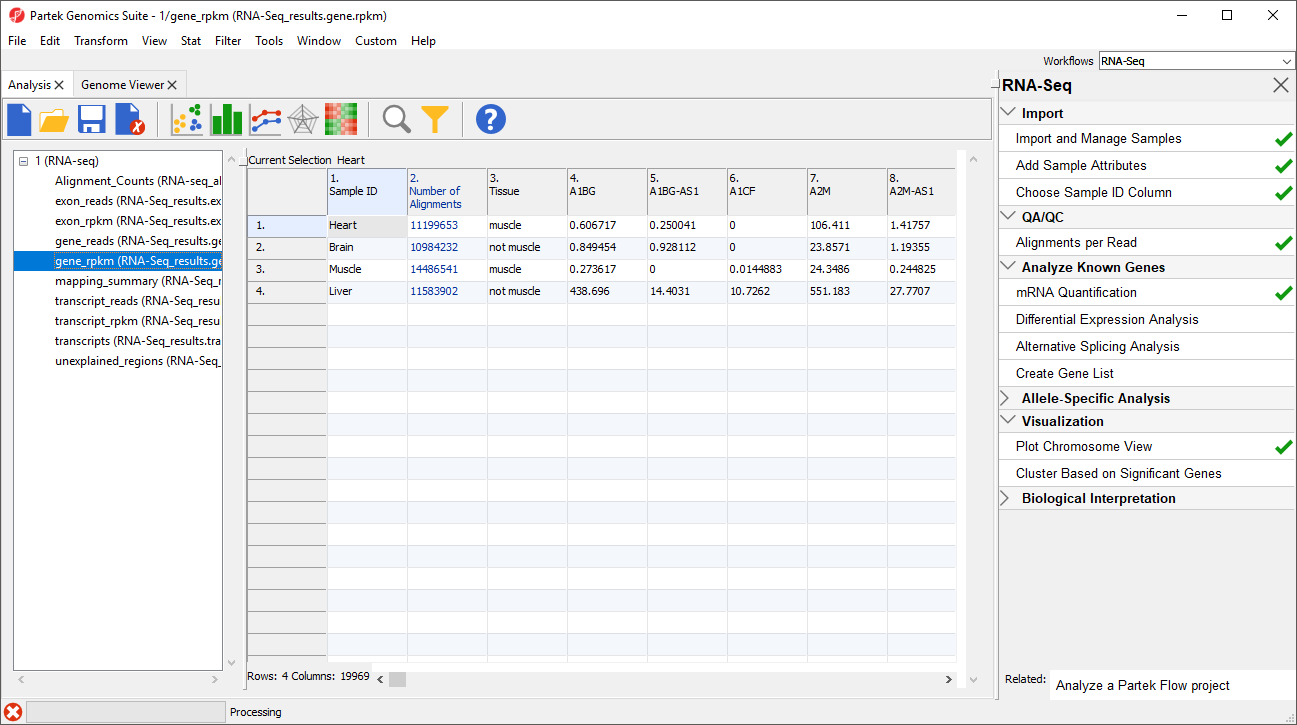
The _reads and _rpkm spreadsheets
Data on features - genes, transcripts, and exons - is presented before and after normalization as _reads and _rpkm spreadsheets. In this tutorial, we have created exon_reads, exon_rpkm, gene_reads, gene_rpkm, transcript_reads, and transcript_rpkm spreadsheets.In these spreadsheets, samples are listed one per row and the normalized counts of the reads mapped to features are in columns (Figure 2).
The _reads and _rpkm spreadsheets can be used for data analysis. Sample grouping can be visualized using PCA. Select View > Scatter Plot from the toolbar or press ![]() on the quick action bar to create a PCA plot from the selected spreadsheet. See Exploratory Gene Expression Data Analysis for an example of using PCA plots for data analysis or consult Chapter 7 of the Partek User's Manual for a detailed introduction to PCA. With replicates in a sample group, you would also be able to use the _rpkm perform Differential expression analysis using ANOVA.
on the quick action bar to create a PCA plot from the selected spreadsheet. See Exploratory Gene Expression Data Analysis for an example of using PCA plots for data analysis or consult Chapter 7 of the Partek User's Manual for a detailed introduction to PCA. With replicates in a sample group, you would also be able to use the _rpkm perform Differential expression analysis using ANOVA.
The transcripts spreadsheet
The transcripts spreadsheet details the analysis results of RNA-Seq if there are no replicates. Each row lists a separate transcript in each row.
It is possible to derive basic information about from the RNA-Seq_result.transcripts spreadsheet about differential and alternative splicing between your samples even if you don’t have replicates from the RNA-Seq_result.transcripts spreadsheet using a simple chi-squared or log-likelihood tests since because each sample is represented only once and the we can assume a null hypothesis is that the transcripts are evenly distributed across all samples. However, the power of Partek Genomics Suite software resides in the implementation of a mixed-model ANOVA that can handle unbalanced and incomplete datasets, nested designs, numerical and categorical variables, any number of factors, and flexible linear contrasts when you do have biological replicates.
...
Overview
Content Tools