Page History
| Table of Contents | ||||||
|---|---|---|---|---|---|---|
|
We are now ready to detect differentially expressed genes measure gene expression in our dataset. To do this, we will use the mRNA quantification task in the Analyze Known Genes section of the RNA-seq Seq workflow. mRNA quantification creates quantification creates spreadsheets showing expression at exon, transcript, and gene levels ; identifies transcripts that are differentially expressed or spliced across all samples; and reports raw and normalize normalized reads for each sample.
Please note that the normalization method used by Partek Genomics Suite is Reads Per Kilobase per Million mapped reads (RPKM) (Mortazavi et al. 2008). In brief, this normalization method counts total reads in a sample, divides by one million to create a per million scaling factor for each sample; then divides the read counts for the feature (exon, transcript, or gene) by the per million scaling factor to normalize for sequencing depth and give a reads per million value; and finally divides reads per million values by the length of the feature (exon, transcript, or gene) in kilobases to normalize for feature size.
- Select 1 (RNA-Seq) from the spreadsheet tree
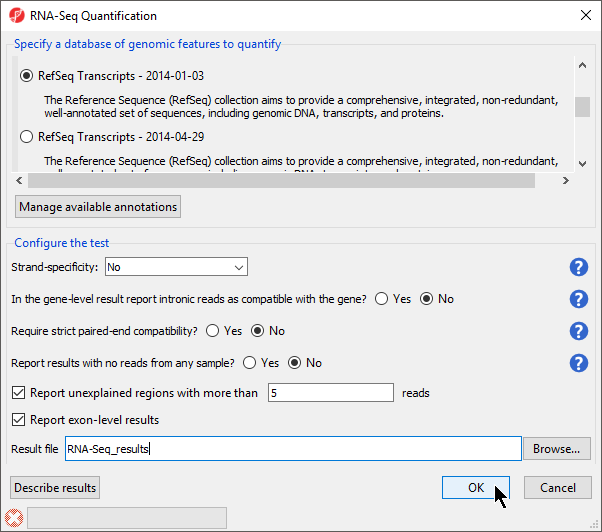
- Select mRNA quantification in the Analyze Known Genes section of the RNA-seq workflow
...
- Select RefSeq Transcripts 20142017-0105-0302 from the mRNA section of the Specify a database of genomic features to quantify panel of the dialog
...
Your choice here depends on the method used for sample preparation. A directional mRNA-seq sample preparation protocol only synthesizes the first strand of cDNA whereas other methods reverse transcribe the mRNA into double-stranded cDNA. If double-stranded cDNA has been synthesized, the sequencer reads sequences from both the forward and reverse strands but does not discriminate between them, eliminating strand information. When strand information is preserved, it is possible for paired-end sequences to come from a combination of the forward and reverse strands. If in doubt, select Auto-detect form from the drop-down list. The data for this tutorial did not preserve strand information so we selected No.
...
| Numbered figure captions | ||||
|---|---|---|---|---|
| ||||
|
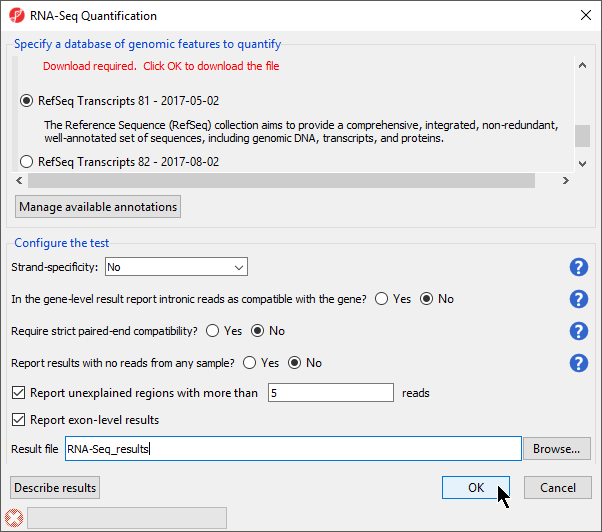
- Select OK to perform the RNA-seq Seq quantification
Reads will now be assigned to individual transcripts of a gene based on the Expectation/Maximization (E/M) algorithm (Xing, et al. 2006). In Partek Genomics Suite software, the E/M algorithm is modified to accept paired-end reads, junction aligned reads, and multiple aligned reads if these are present in your data. For a detailed description of the E/M algorithm, refer to the RNA-Seq white paper (Help > On-line Tutorials > White Papers). Several spreadsheets containing the analyzed results will be generated. Progress bars in the lower left-hand corner RNA-seq Seq Quantification window and the main window will update as the data is analyzed.
...
The Analysis tab now shows the spreadsheets created by mRNA Quantification in the spreadsheet tree as a child spreadsheets spreadsheet of 1 (RNA-seq) (Figure 2).
...
| Numbered figure captions | ||||
|---|---|---|---|---|
| ||||
|
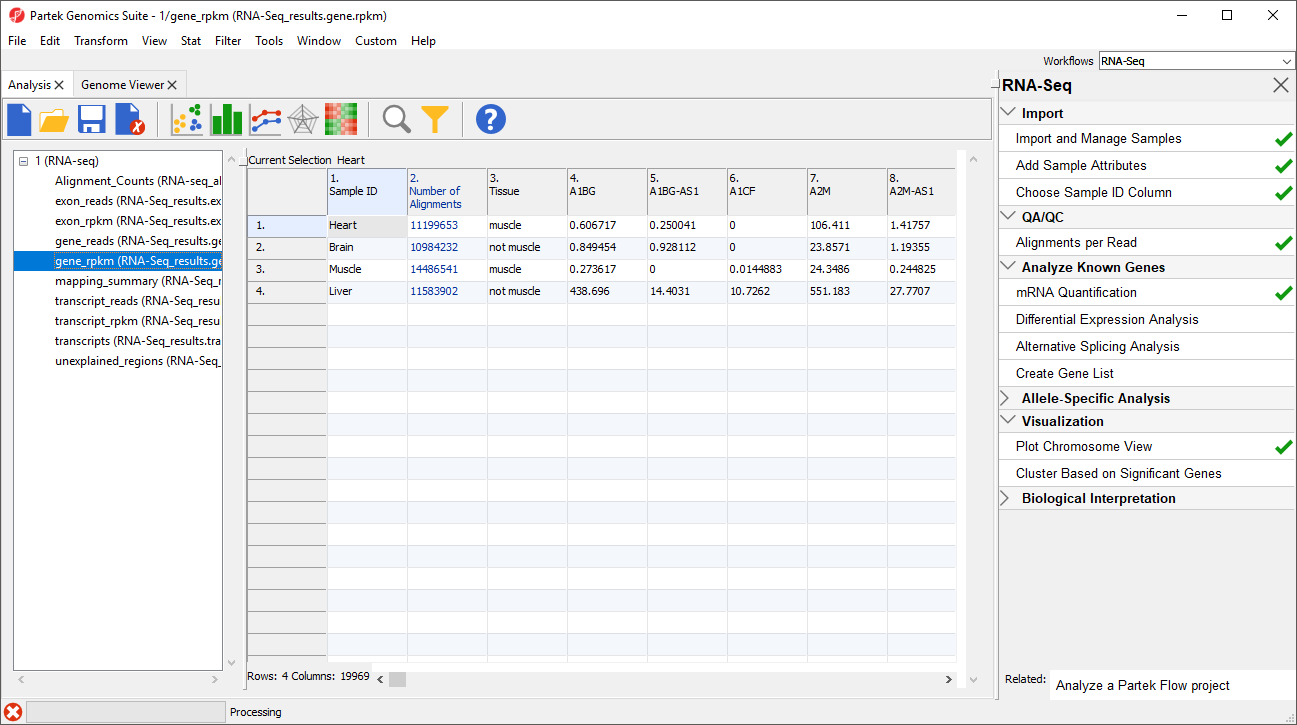
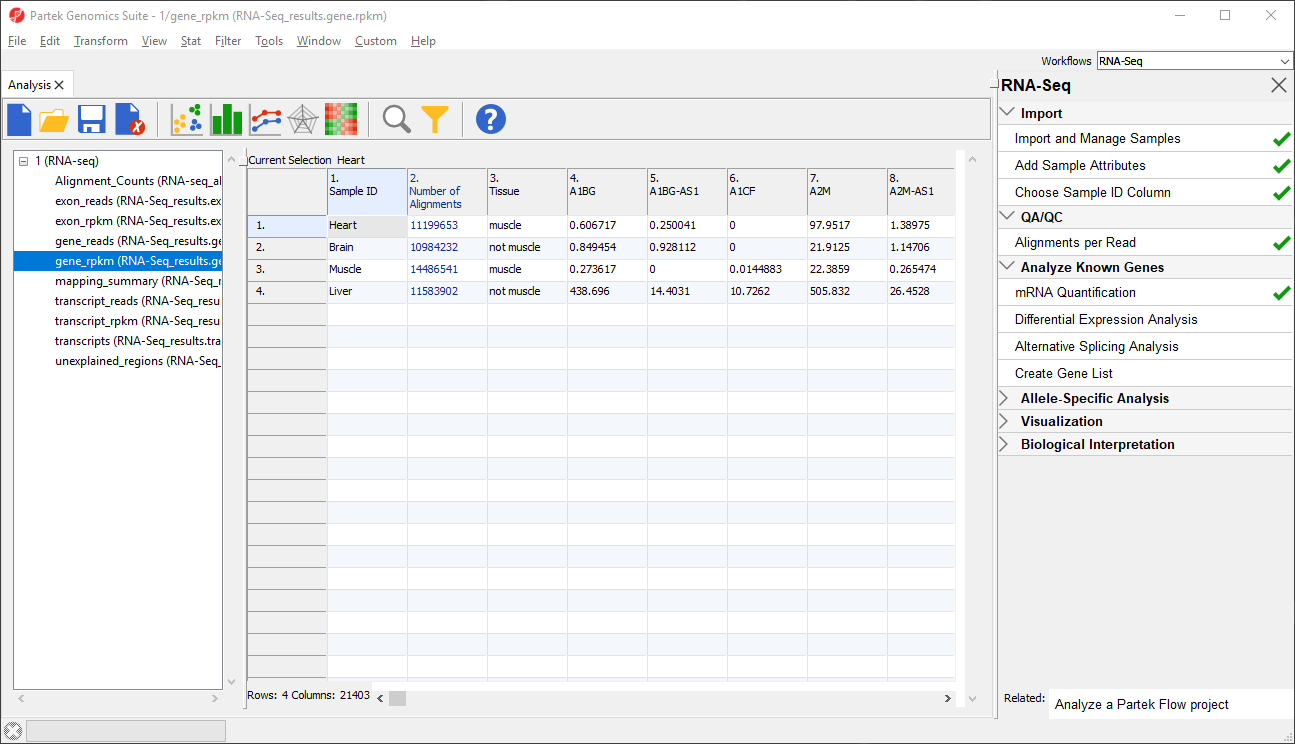
The _reads and _rpkm spreadsheets
Data on features - genes, transcripts, and exons - is are presented before and after normalization as _reads and _rpkm spreadsheets. In this tutorial, we have created exon_reads, exon_rpkm, gene_reads, gene_rpkm, transcript_reads, and transcript_rpkm spreadsheets.In these spreadsheets, samples are listed one per row and the normalized counts of the reads mapped to features are in columns (Figure 2).
The _reads and _rpkm spreadsheets can be used for data analysis. Sample grouping can be visualized using PCA. Select View > Scatter Plot from the toolbar or press ![]() on the quick action bar to create a PCA plot from the selected spreadsheet. See Exploratory Gene Expression Data AnalysisExploring gene expression data for an example of using PCA plots for data analysis or consult Chapter 7 of the Partek User's Manual for a detailed introduction to PCA. With replicates in a sample group, you would also be able to use the _rpkm perform Differential spreadsheet to perform differential expression analysis using ANOVA.
on the quick action bar to create a PCA plot from the selected spreadsheet. See Exploratory Gene Expression Data AnalysisExploring gene expression data for an example of using PCA plots for data analysis or consult Chapter 7 of the Partek User's Manual for a detailed introduction to PCA. With replicates in a sample group, you would also be able to use the _rpkm perform Differential spreadsheet to perform differential expression analysis using ANOVA.
The transcripts spreadsheet
The transcripts spreadsheet details the analysis results of RNA-Seq if there are no replicates. Each row lists a separate transcript in each row.
It is possible to derive basic information about from the RNA-Seq_result.transcripts spreadsheet about differential and alternative splicing between your samples even if you don’t have replicates from the RNA-Seq_result.transcripts spreadsheet using a simple chi-squared or log-likelihood tests since because each sample is represented only once and the we can assume a null hypothesis is that the transcripts are evenly distributed across all samples. However, the power of Partek Genomics Suite software resides in the implementation of a mixed-model ANOVA that can handle unbalanced and incomplete datasets, nested designs, numerical and categorical variables, any number of factors, and flexible linear contrasts when you do have biological replicates.
...
The contents of this spreadsheet are explained in more detail in a later section of the tutorial - ___.
Analyzing the unexplained regions spreadsheet.
References
Mortazavi, A., Williams, B.A., McCue, K., Schaeffer, L., & Wold, B. Mapping and quantifying mammalian transcriptomes by RNA-Seq. Nature, 2008; 5: 621-8.
Xing Y, Yu T, Wu YN, Roy M, Kim J, Lee C: An expectation-maximization algorithm for probalisitic reconstructions of full-length isoforms from splice graphs. Nucleic Acids Res 2006, 34: 3150-3160.
| Page Turner | ||
|---|---|---|
|
...
Overview
Content Tools