Page History
...
Please note that the normalization method used by Partek Genomics Suite is Reads Per Kilobase per Million mapped reads (RPKM) (Mortazavi et al. 2008). In brief, this normalization method counts total reads in a sample, divides by one million to create a per million scaling factor for each sample; then divides the read counts for the feature (exon, transcript, or gene) by the per million scaling factor to normalize for sequencing depth and give a reads per million value; and finally divides reads per million values by the length of the feature (exon, transcript, or gene) in kilobases to normalize for feature size.
- Select 1 (RNA-Seq) from the spreadsheet tree
- Select mRNA quantification in the Analyze Known Genes section of the RNA-seq workflow
...
- Select RefSeq Transcripts 20142017-0105-0302 from the mRNA section of the Specify a database of genomic features to quantify panel of the dialog
...
| Numbered figure captions | ||||
|---|---|---|---|---|
| ||||
|
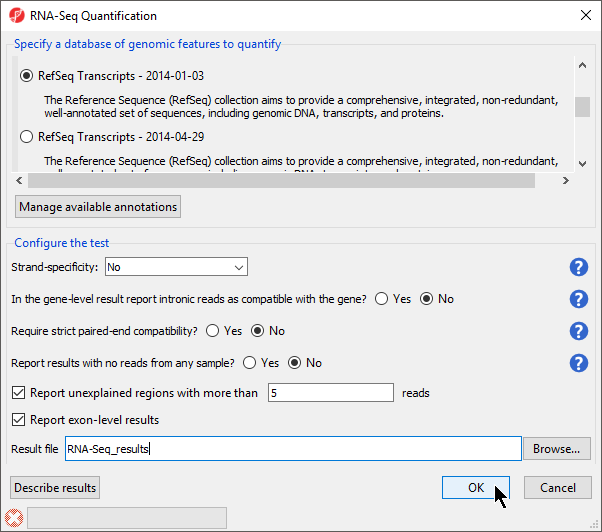
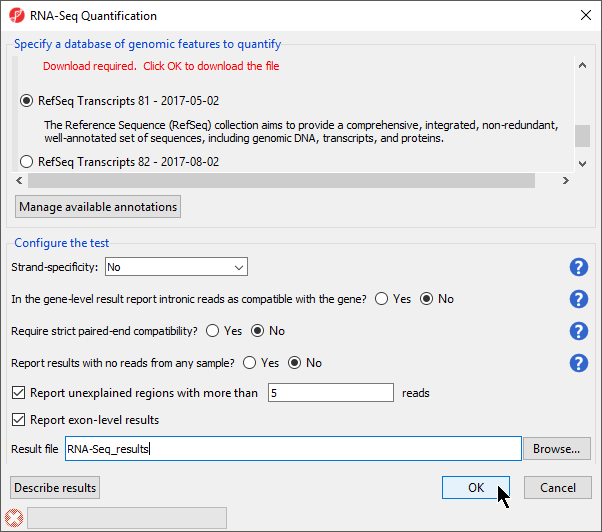
- Select OK to perform the RNA-Seq quantification
...
| Numbered figure captions | ||||
|---|---|---|---|---|
| ||||
|
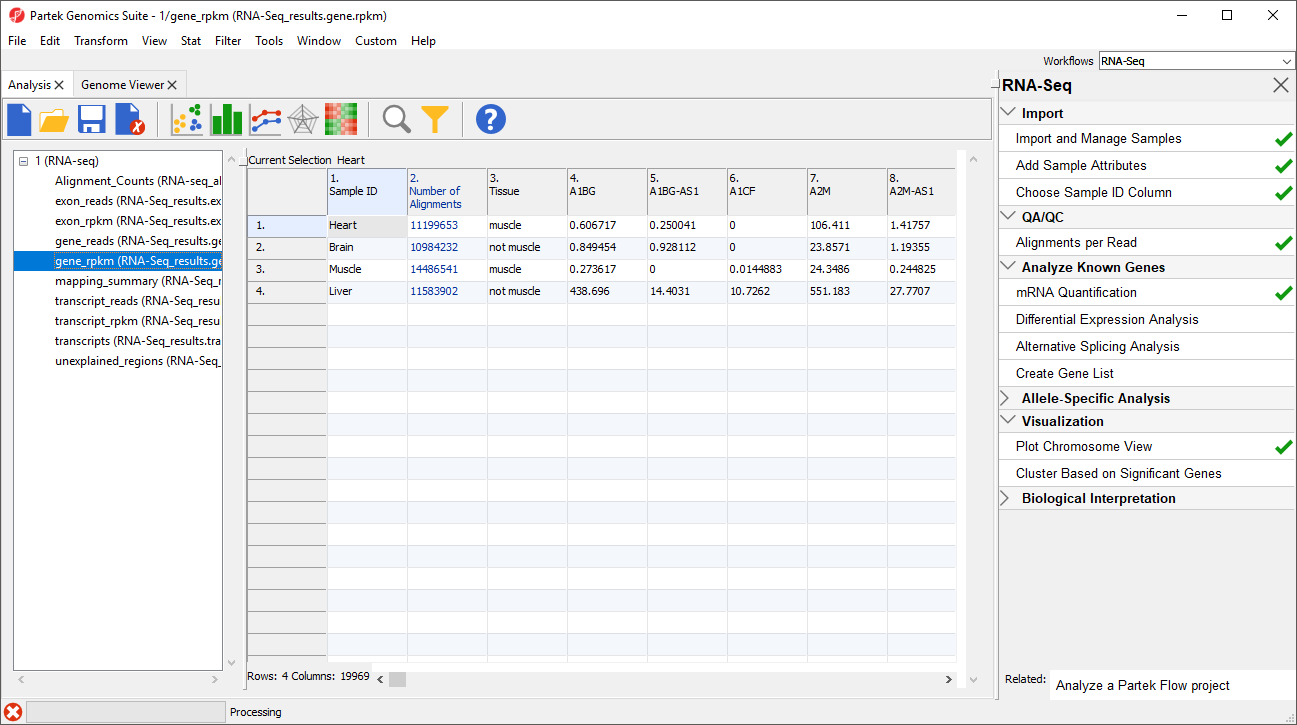
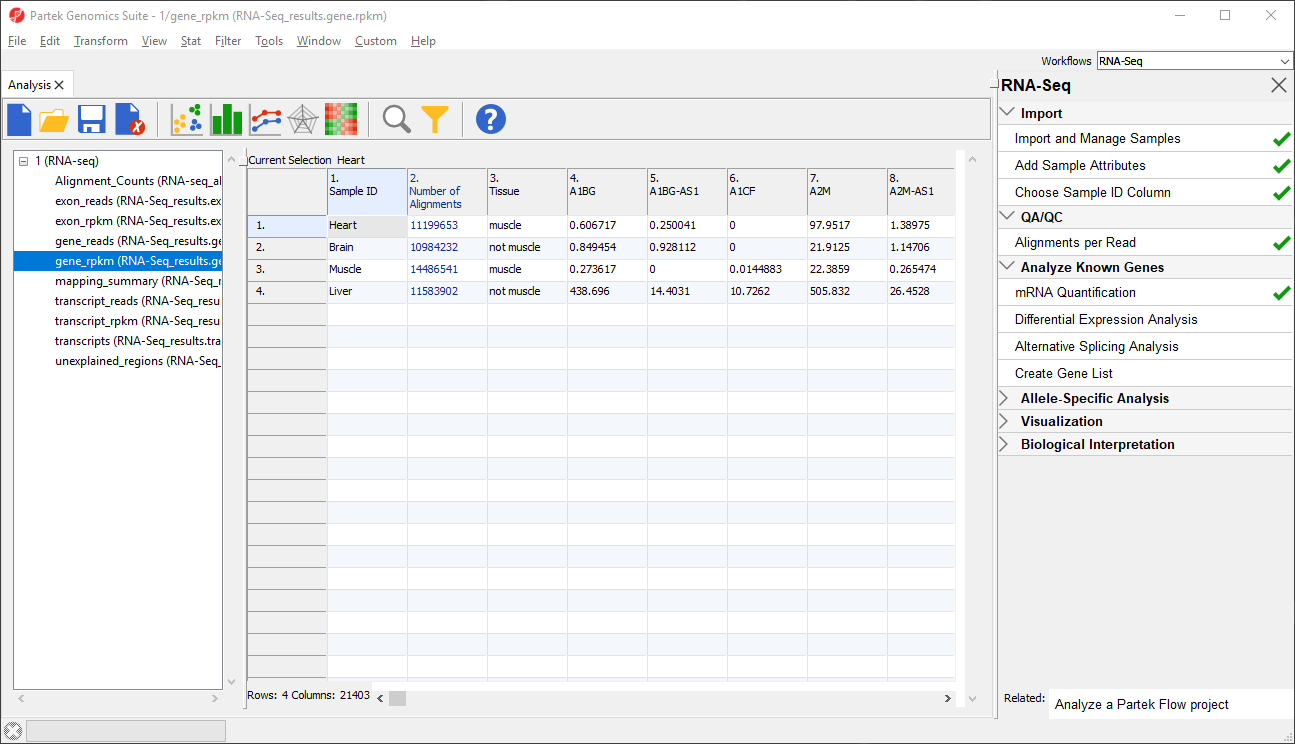
The _reads and _rpkm spreadsheets
...
The _reads and _rpkm spreadsheets can be used for data analysis. Sample grouping can be visualized using PCA. Select View > Scatter Plot from the toolbar or press ![]() on the quick action bar to create a PCA plot from the selected spreadsheet. See Exploring Gene Expression Datagene expression data for an example of using PCA plots for data analysis or consult Chapter 7 of the Partek User's Manual for a detailed introduction to PCA. With replicates in a sample group, you would also be able to use the _rpkm spreadsheet to perform differential expression analysis using ANOVA.
on the quick action bar to create a PCA plot from the selected spreadsheet. See Exploring Gene Expression Datagene expression data for an example of using PCA plots for data analysis or consult Chapter 7 of the Partek User's Manual for a detailed introduction to PCA. With replicates in a sample group, you would also be able to use the _rpkm spreadsheet to perform differential expression analysis using ANOVA.
...
The contents of this spreadsheet are explained in more detail in a later section of the tutorial - Detecting Unexplained Regions Analyzing the unexplained regions spreadsheet.
References
Mortazavi, A., Williams, B.A., McCue, K., Schaeffer, L., & Wold, B. Mapping and quantifying mammalian transcriptomes by RNA-Seq. Nature, 2008; 5: 621-8.
Xing Y, Yu T, Wu YN, Roy M, Kim J, Lee C: An expectation-maximization algorithm for probalisitic reconstructions of full-length isoforms from splice graphs. Nucleic Acids Res 2006, 34: 3150-3160.
...
Overview
Content Tools