Page History
...
| Numbered figure captions | ||||
|---|---|---|---|---|
| ||||
|
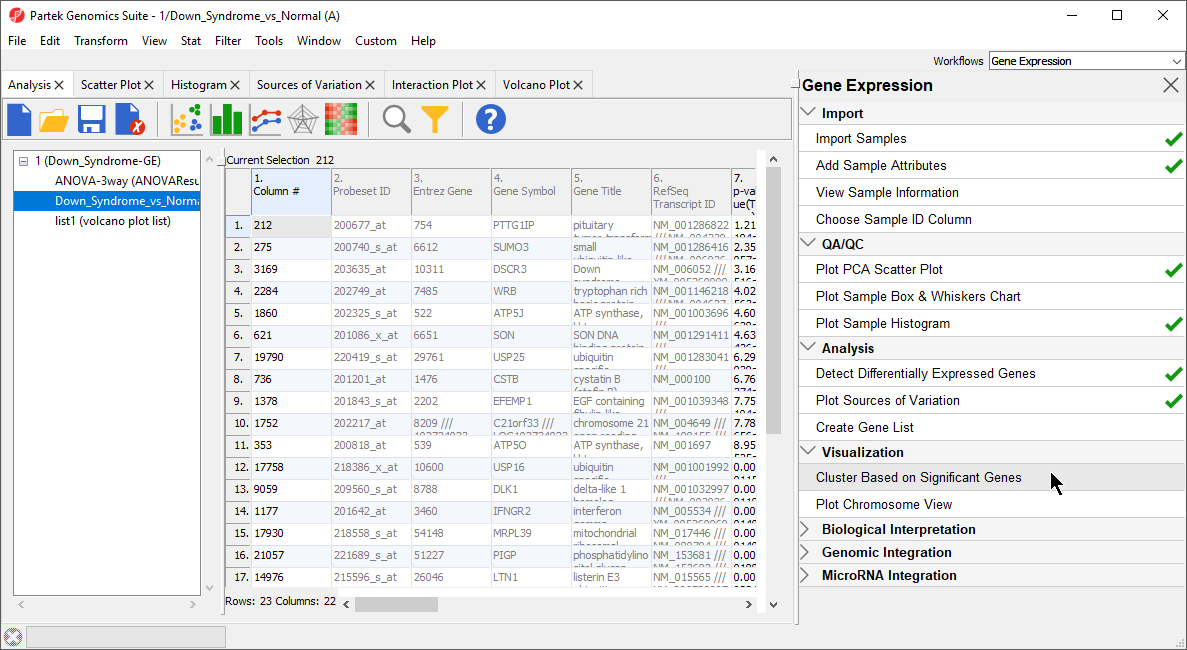
- The Cluster Significant Genes dialog asks you to specify the type of clustering you want to perform. Select Hierarchical Clustering and select OK
- Choose the Down_Syndrome_vs_Normal (A) spreadsheet under the Spreadsheet with differentially expressed genes
- Choose the Standardize – shift genes to mean of zero and scale to standard deviation of one under the Expression normalization panel. This option will adjust all the gene intensities such that the mean is zero and the standard deviation is 1
- Select OK to generate a Hierarchical Clustering tab (Figure 2)
| Numbered figure captions | ||||
|---|---|---|---|---|
| ||||
|
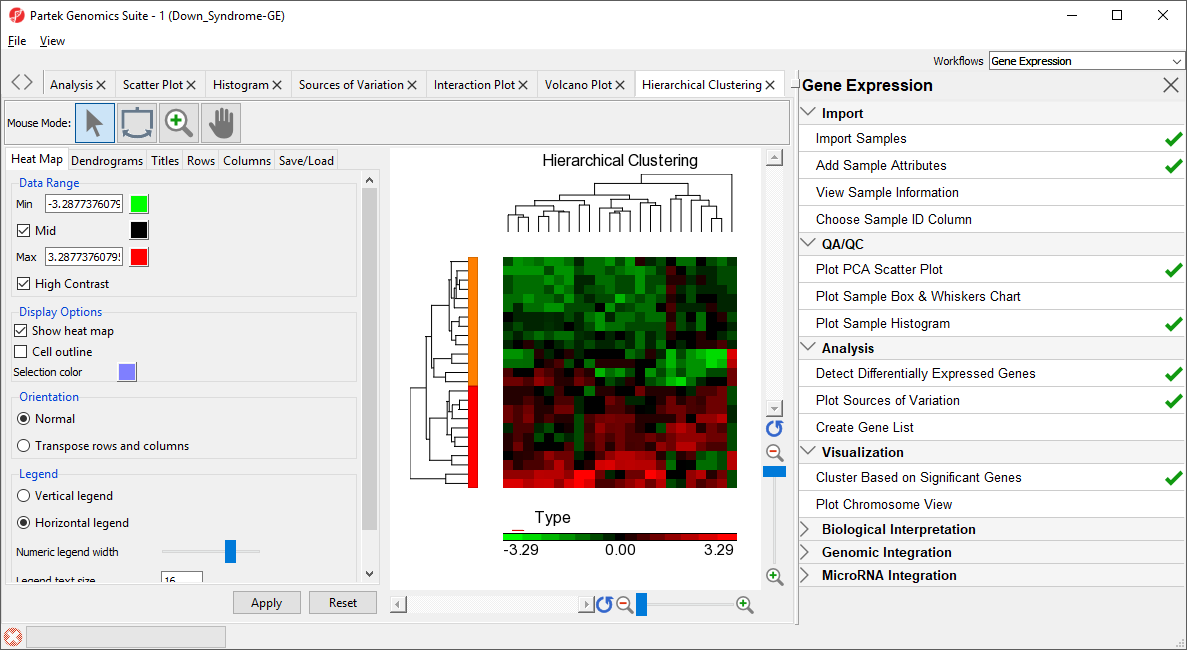
For more information on the methods used for clustering, you can refer to Chapter 8: Hierarchical & Partitioning Clustering in Help > User’s Manual. For a tutorial on configuring the clustering plot, please refer to the user guide that can be downloaded from: here or from Help >On-line Tutorials > User Guides.
...
| Numbered figure captions | ||||
|---|---|---|---|---|
| ||||
|
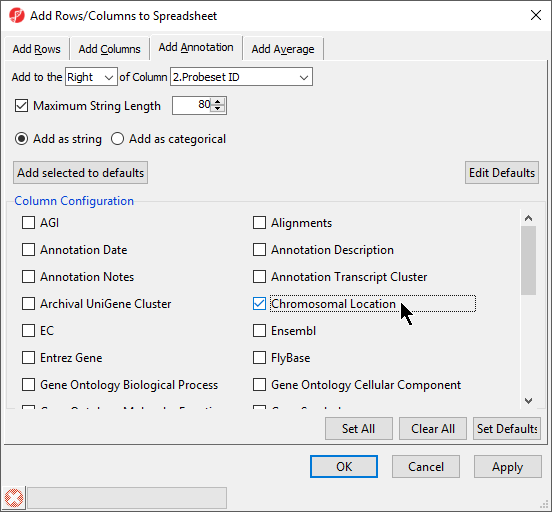
- Select Chromosomal Location under the Column Configuration panel (Figure 4). Leave everything else as default and select OK
| Numbered figure captions | ||||
|---|---|---|---|---|
| ||||
|
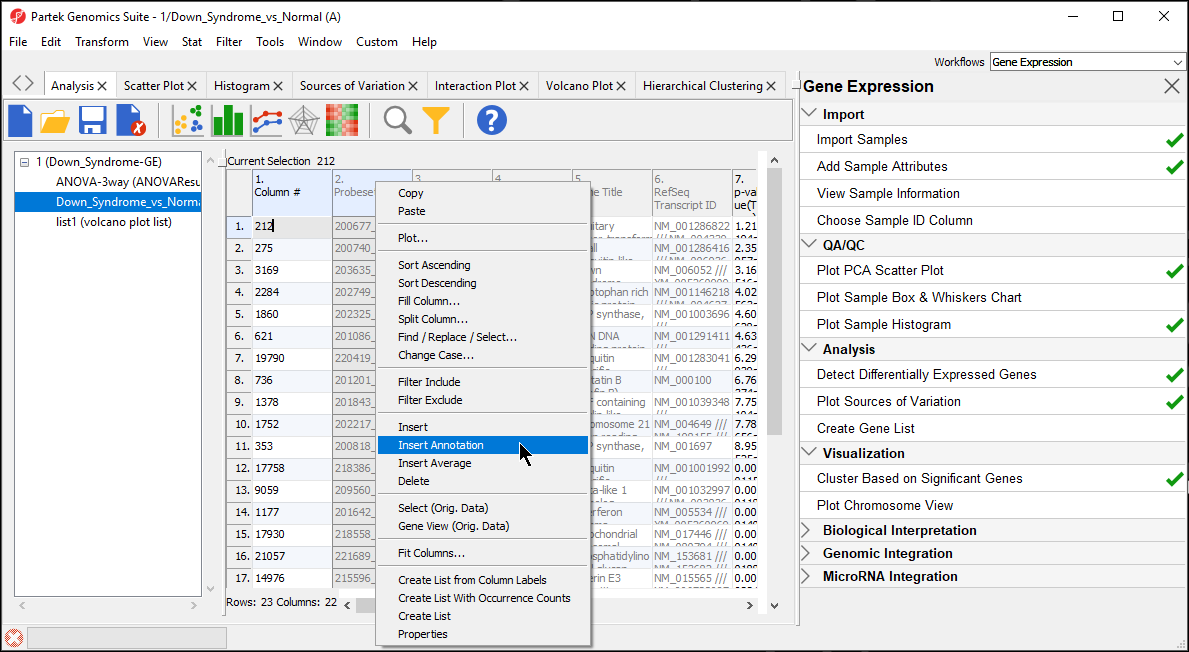
- To create a dot plot showing expression levels of a specific gene for each sample, right click on the row header and select Dot Plot (Orig. Data) from the pop-up menu. This generates a Dot Plot tab for the selected gene (Figure 5)
...
Overview
Content Tools