Page History
...
| Numbered figure captions | ||||
|---|---|---|---|---|
| ||||
|
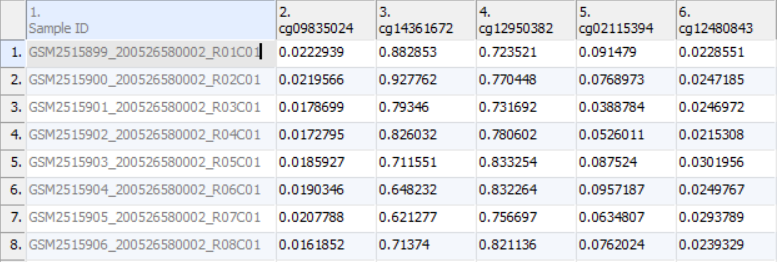
As discussed in the previous chapter, the values in the cells are normalized β-values, which correspond to the percentage of methylation at each site and are calculated as the ratio of methylated probe intensity over the overall intensity at each site (the overall intensity is the sum of methylated and unmethylated probe intensities). An alternative metric for measurement of methlyation levels are M-values. β-values can be easily converted to M-values using the following equation:
...
Overview
Content Tools