Page History
| Table of Contents | ||||||
|---|---|---|---|---|---|---|
|
Creating a gene list with the ANOVA Streamlined list manager
...
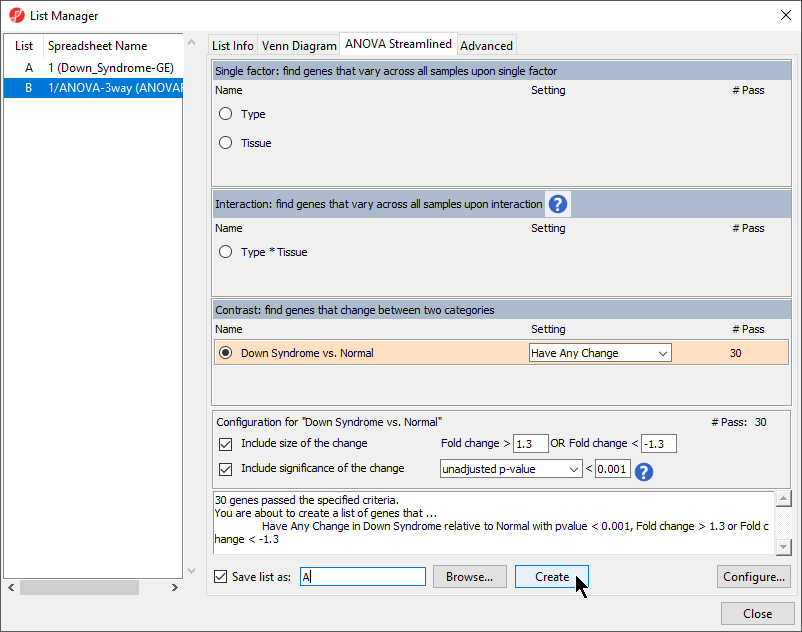
- Invoke the List Manager dialog by selecting Create Gene List in the Analysis section of the Gene Expression workflow
- Ensure that the 1/ANOVA-3way (ANOVAResults) spreadsheet is selected as this is the spreadsheet we will be using to create our new gene list as shown (Figure 91)
- Select the ANOVA Streamlined tab. In the
- Set Contrast: find genes that change between two categories panel, choose to Down Syndrome vs. Normal and select Have Any Change from the Setting dropdown drop-down menu list.
This will find genes with different expression levels in the different types of samples.
- In the Configuration for “Down Syndrome vs Normal” panel, check that Include size of the change is selected and enter 1.3 into Fold change Change > and -1.3 in OR Fold change Change <
- Select Include significance of the change, choose unadjusted p-value from the dropdown menu, and < 0.0005 001 for the cutoff. cutoff
The number of genes that pass your cutoff criteria will be shown next to the # Pass field. In this example,
...
30 genes pass the criteria.
...
- Set Save the list as A, select Create, and then select
- Select Create to generate the new list A
- Select Close to view the new gene list spreadsheet
| Numbered figure captions | ||||
|---|---|---|---|---|
| ||||
|

The spreadsheet Down_Syndrome_vs_Normal (A) will be created as a child spreadsheet under the Down_Syndrome-GE spreadsheet.
...
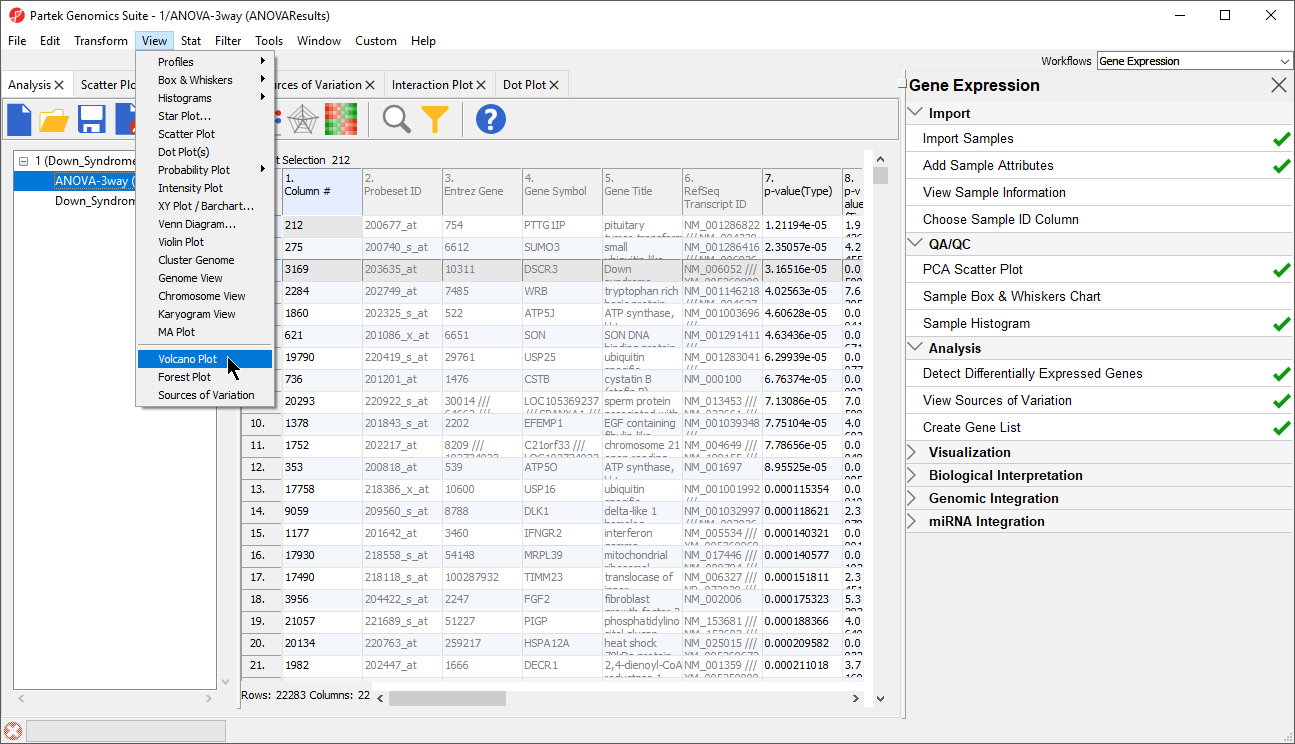
- Select the 1/ANOVA-3way (ANOVAResults) spreadsheet in the Analysis tab. This is the spreadsheet our gene list will be drawn from
- Select View > Volcano Plot from the Partek Genomics Suite main menu (Figure 102)
| Numbered figure captions | ||||
|---|---|---|---|---|
| ||||
|

- Set X Axis (Fold-Change) to 12. Fold-Change(Down Syndrome vs. Normal), and the Y axis (p-value) to be 1110. p-value(Down Syndrome vs. Normal)
- Select OK to generate a Volcano Plot tab for genes in the ANOVA spreadsheet (Figure 113)
| Numbered figure captions | ||||
|---|---|---|---|---|
| ||||
|

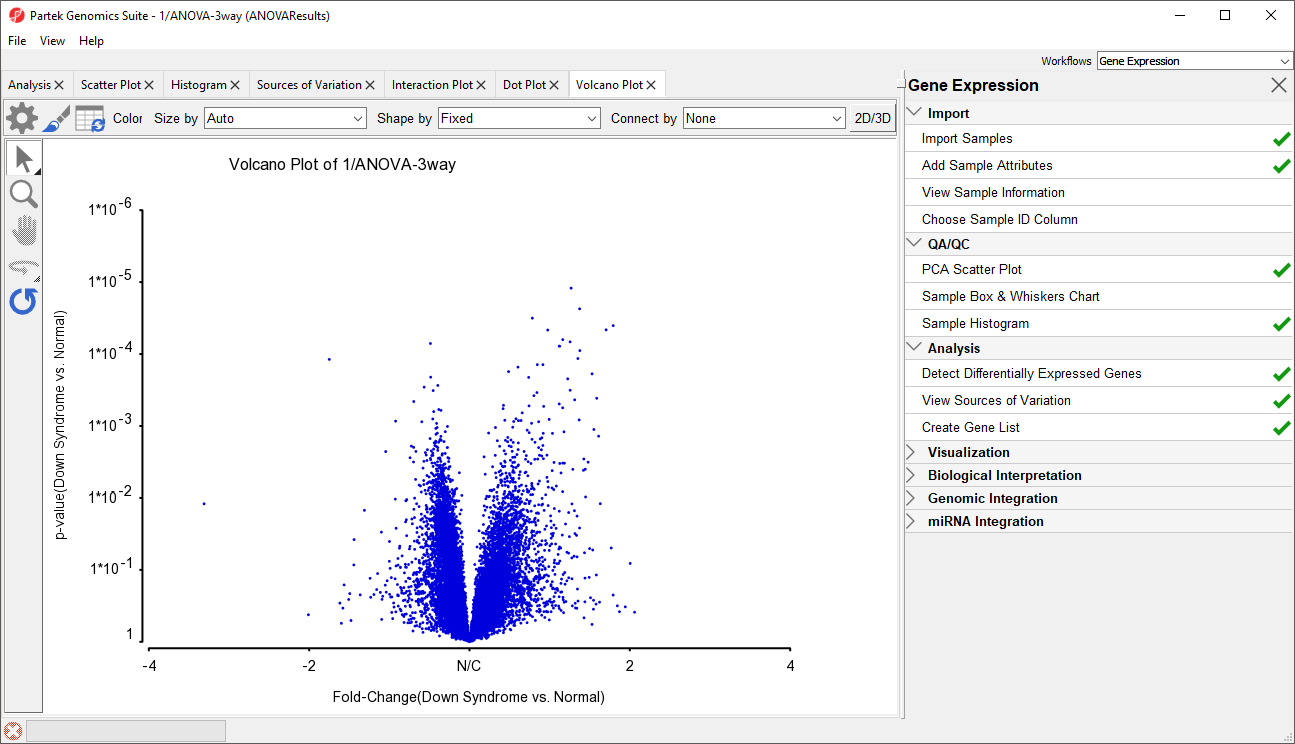
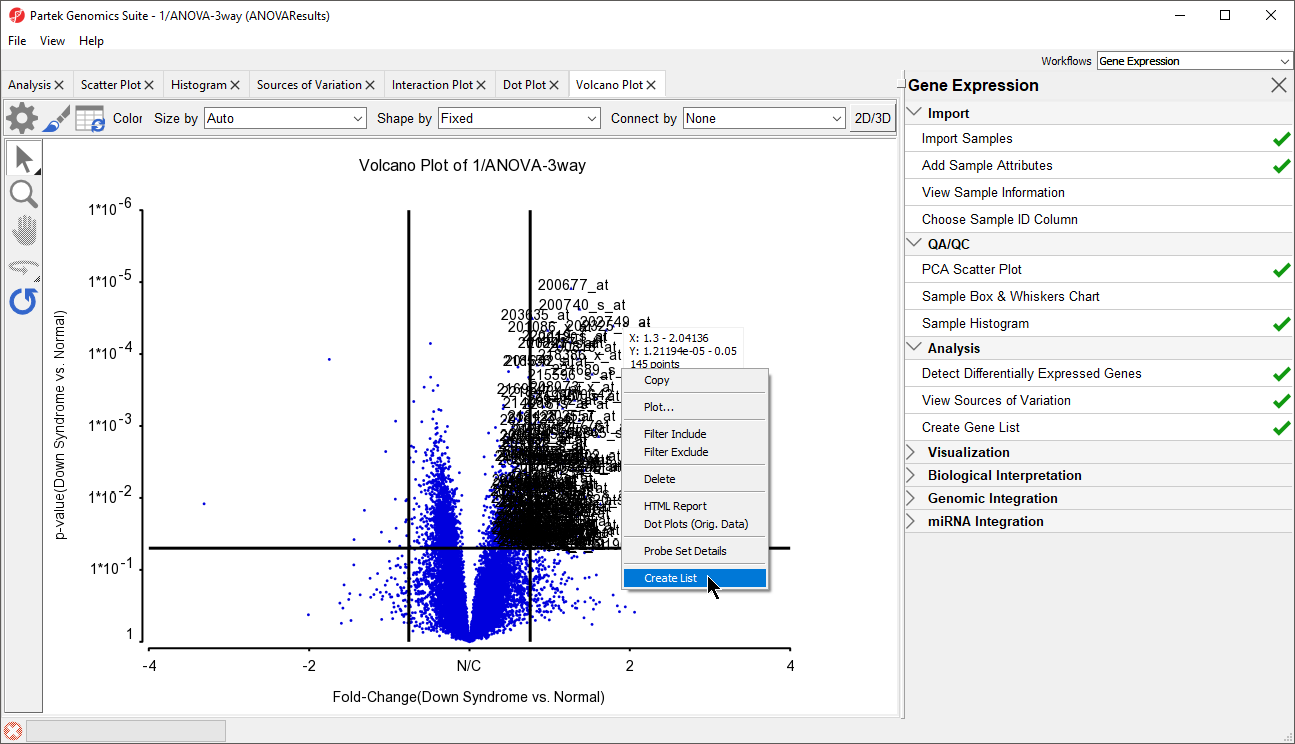
In the plot, each dot represents a gene. The X-axis represents the fold change of the contrast (Down syndrome vs. Normal), and the Y-axis represents the range of p-values. The genes with increased expression in Down syndrome samples are on the right side of the N/C (no change) line; genes with reduced expression in Down syndrome samples are on the left. The genes become more statistically significant with increasing Y-axis position. The genes that have larger and more significant changes between the Down syndrome and normal groups are on the upper right and upper left corner.
...
- Select Rendering Properties (
 )
) - Choose the Axes tab
- Check Select all points in a section to allow Partek Genomics Suite to automatically select all the points in any given section
- Select the Set Cutoff Lines button and configure the Set Cutoff Lines dialog as shown (Figure 124)
| Numbered figure captions | ||||
|---|---|---|---|---|
| ||||
|

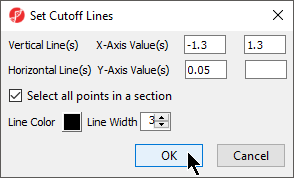
- Select OK to draw the cutoff lines
- Select OK in the Plot Rendering Properties dialog to close the dialog and view the plot
...
- Right-click on the selected region in the plot and choose Create List to create a list including the genes from the section selected (Figure 135). Note that these p-values are uncorrected
| Numbered figure captions | ||||
|---|---|---|---|---|
| ||||
|

Note: If no column is selected in the parent (ANOVA) spreadsheet, all of the columns will be included in the gene list; if some columns are selected, only the selected columns will be included in the list.
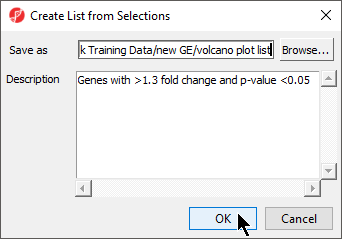
- Specify a name for the gene list (example: volcano plot list) and write a brief description about the list.
The description is shown when you right-click on the spreadsheet
...
> Info > Comments.
...
Here, I have named the list "volcano plot list" and described it as "Genes with >1.3 fold change and p-value <0.05" (Figure
...
6).
...
The list can be saved as a text file (File > Save As Text File) for use in reports or by downstream analysis software.
...
| Numbered figure captions | ||||
|---|---|---|---|---|
| ||||
|

| Page Turner | ||
|---|---|---|
|
...
Overview
Content Tools