The significant CpG loci detected in the previous step actually form a methylation signature that differentiates , which we shall now visualise by between LCLs and B cells. We can build and visualize this methylation signature using clustering and a heat map.
- Select the (CpG of interest) LCLs_vs_Bcells_CpG_Islands spreadsheet in the spreadsheet pane on the left
- Select Cluster Based on Significant Genes from the Visualization panel of the Illumina BeadArray Methylation workflow
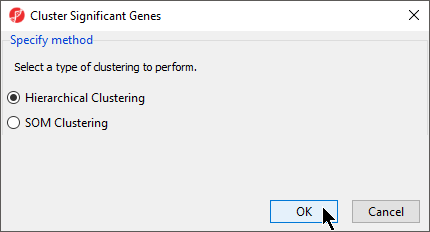
- Select Hierarchical Clustering for Specify Method (Figure 1)
| Numbered figure captions |
|---|
| SubtitleText | Selecting Heirarchical Clustering for clustering method |
|---|
| AnchorName | Selecting clustering method |
|---|
|
|
- Select OK
- Verify that (CpG of interest) is that LCLs_vs_Bcells_CpG_Islands is selected in the drop-down menu
- Select Verify that Standardize is selected for Expression normalization (Figure 2)
| Numbered figure captions |
|---|
| SubtitleText | Selecting spreadsheet and normalization method for clustering |
|---|
| AnchorName | Selecting normalization for clustering |
|---|
|
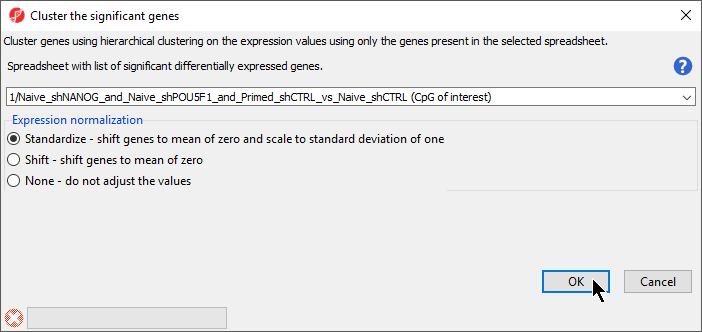 Image Removed Image Removed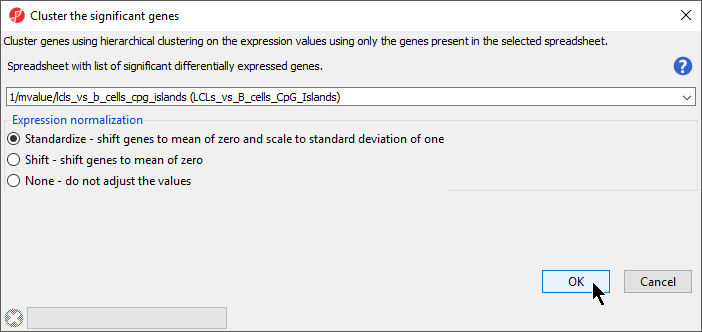 Image Added Image Added
|
The heat map will be displayed on the Hierarchical Clustering tab (Figure 3).
| Numbered figure captions |
|---|
| SubtitleText | Hierarchical clustering with heat map invoked on a list of significant CpG loci |
|---|
| AnchorName | heat map |
|---|
|
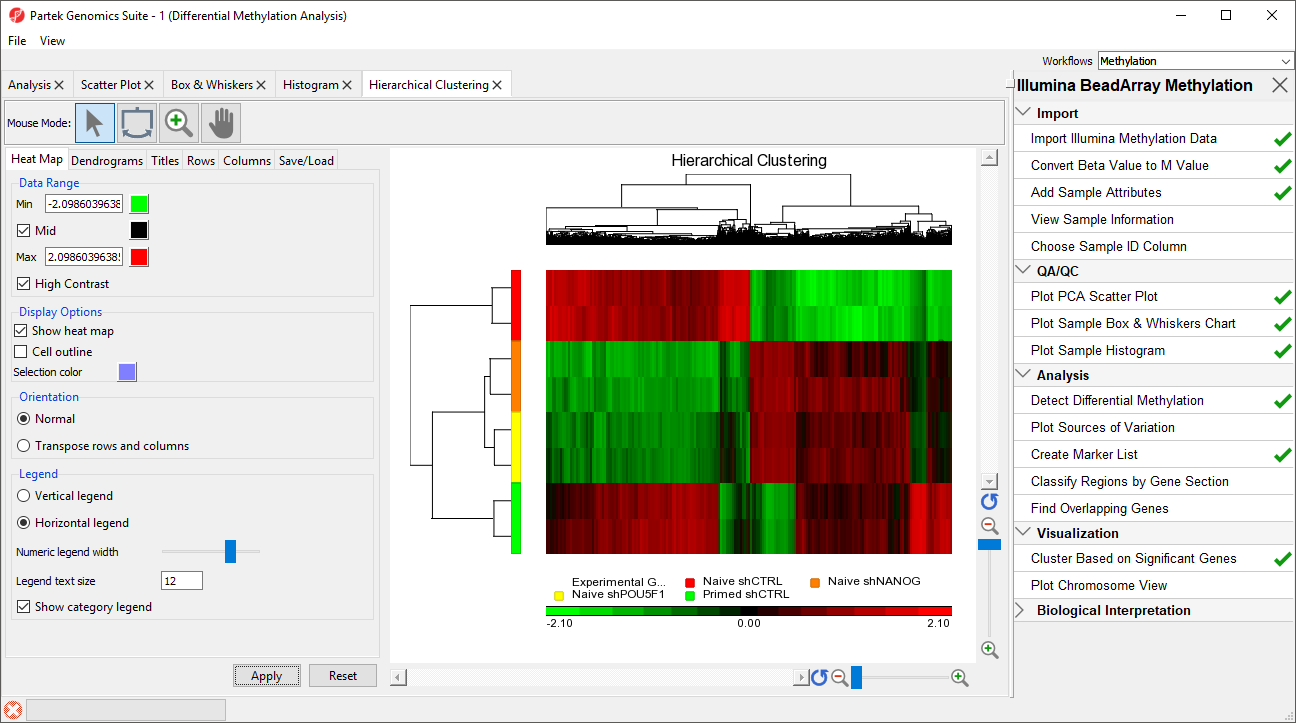 Image Removed Image Removed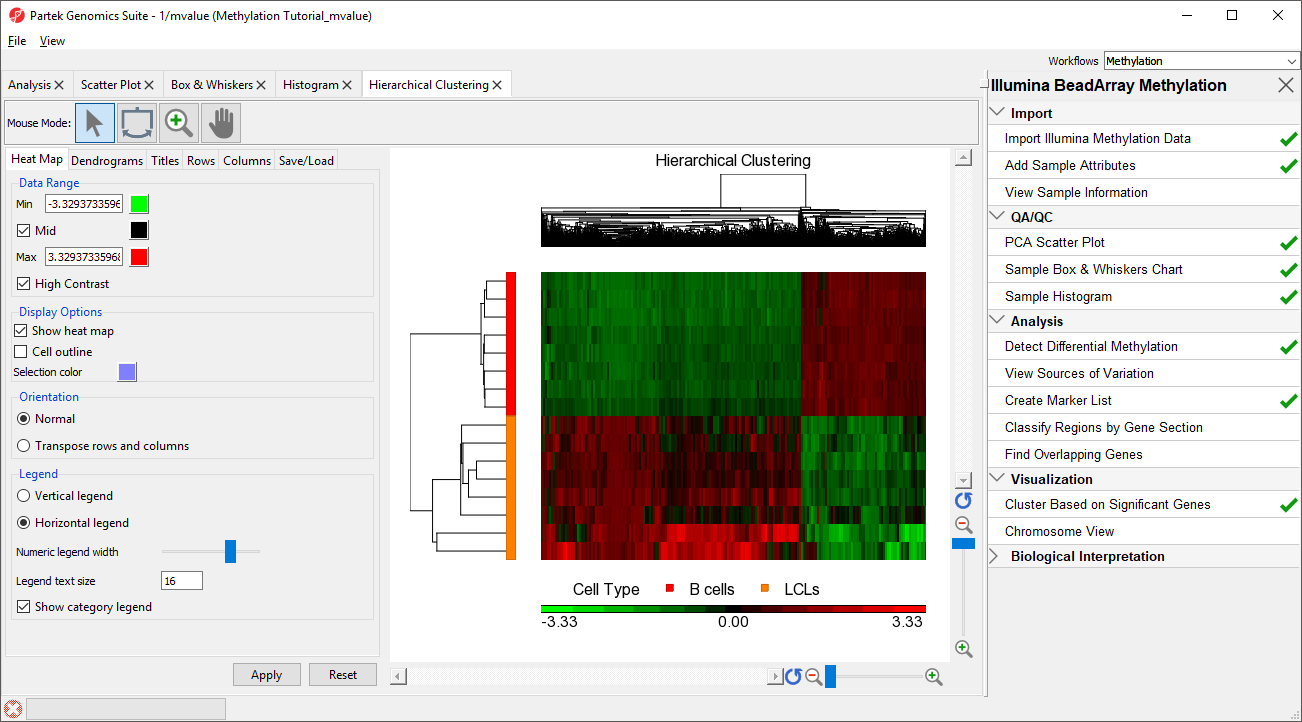 Image Added Image Added
|
The experimental groups are rows, while the CpG loci from the
(CpG of interest) LCLs vs B cells spreadsheet are columns. Methylation levels are compared between
Naive shPOU5F1, Naive shNANG, and Primed shCTRL vs. Naive shCTRL. the LCLs and B cells groups. CpG loci with higher methylation are colored red, CpG loci with lower methylation are colored green.
As expected, the Naive shPOU5F1, Naive shNANG, and Primed shCTRL experimental conditions cluster together; however, we can also see regions of similarity between Primed shCTRL and Naive shCTRL. This suggests that treatment with shRNA against POU5F1 or NANOG brings the methylation profile of naive hPSCs closer to that of primed hPSCs, but also causes additional changes not observed in either primed or naive hPSCsLCLs samples are colored orange and B cells samples are colored red in the dendrogram on the the left-hand side of the heat map.
...