Page History
...
| Numbered figure captions | ||||
|---|---|---|---|---|
| ||||
|

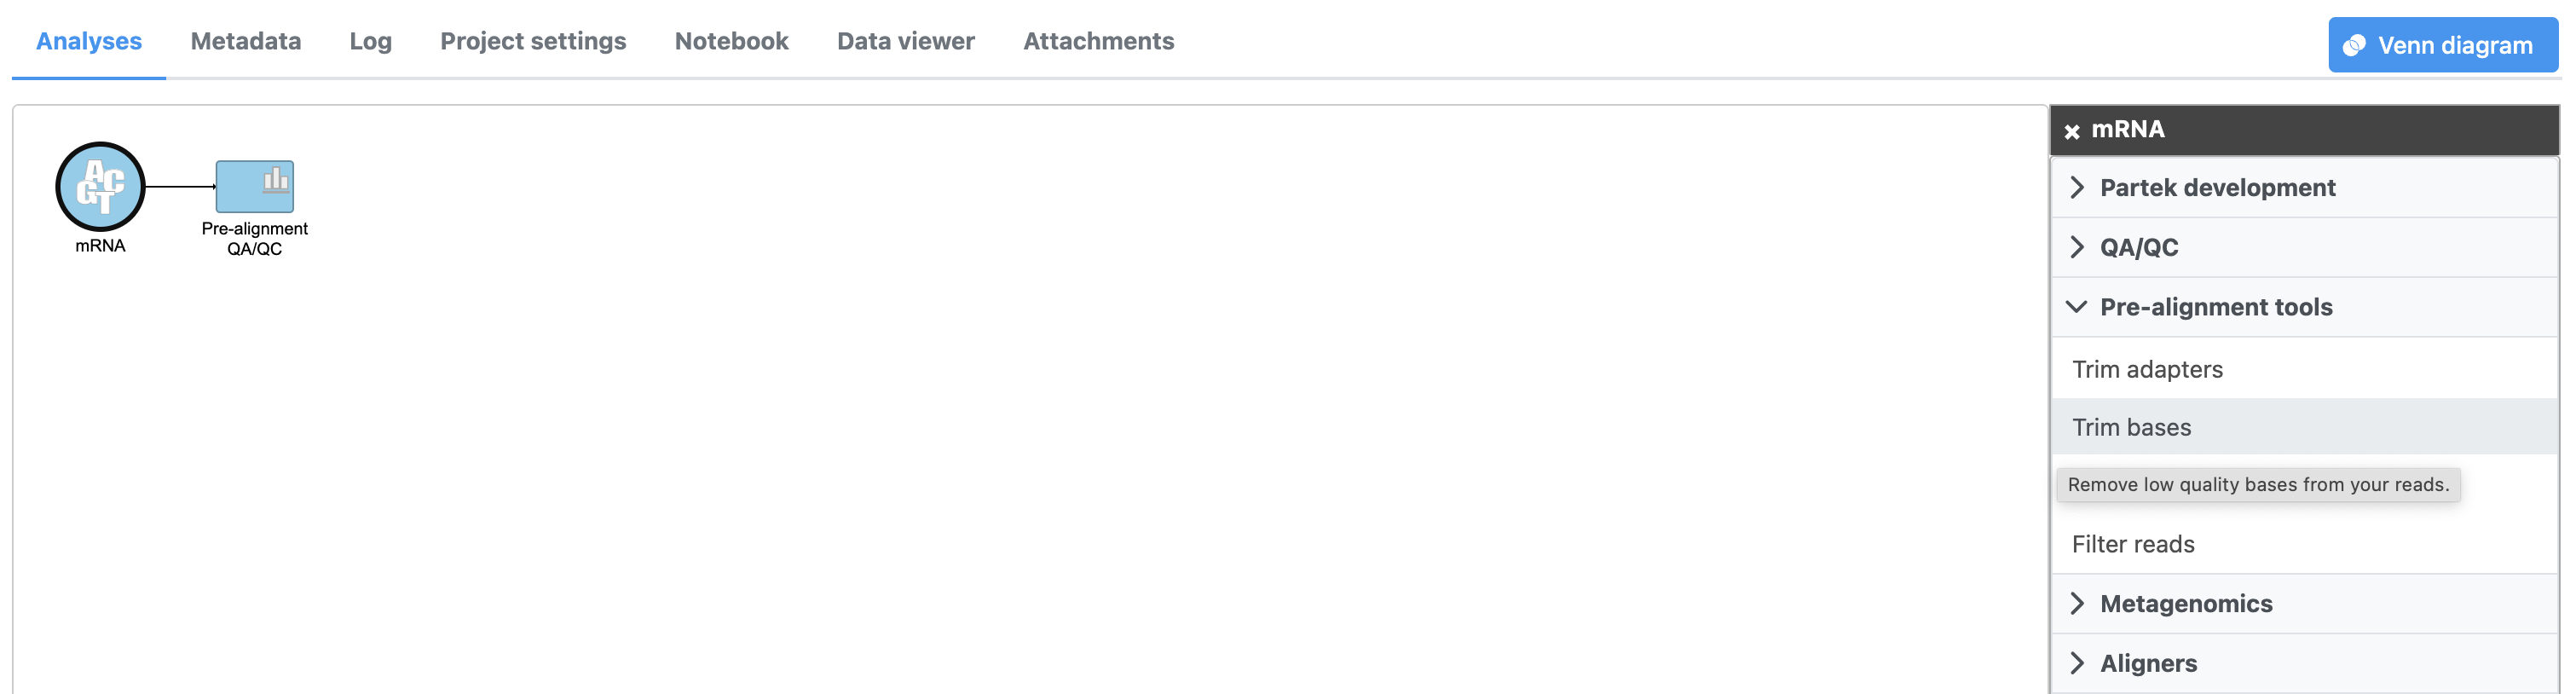
By default, Trim bases removes bases removes bases starting at the 3' end and continuing until it finds a base pair call with a Phred score of equal to or greater than 20. Hover over the  for additional information on any task option 35 (Figure 2).
- Click Finish to run Trim bases with default settings
| Numbered figure captions | ||||
|---|---|---|---|---|
| ||||
|

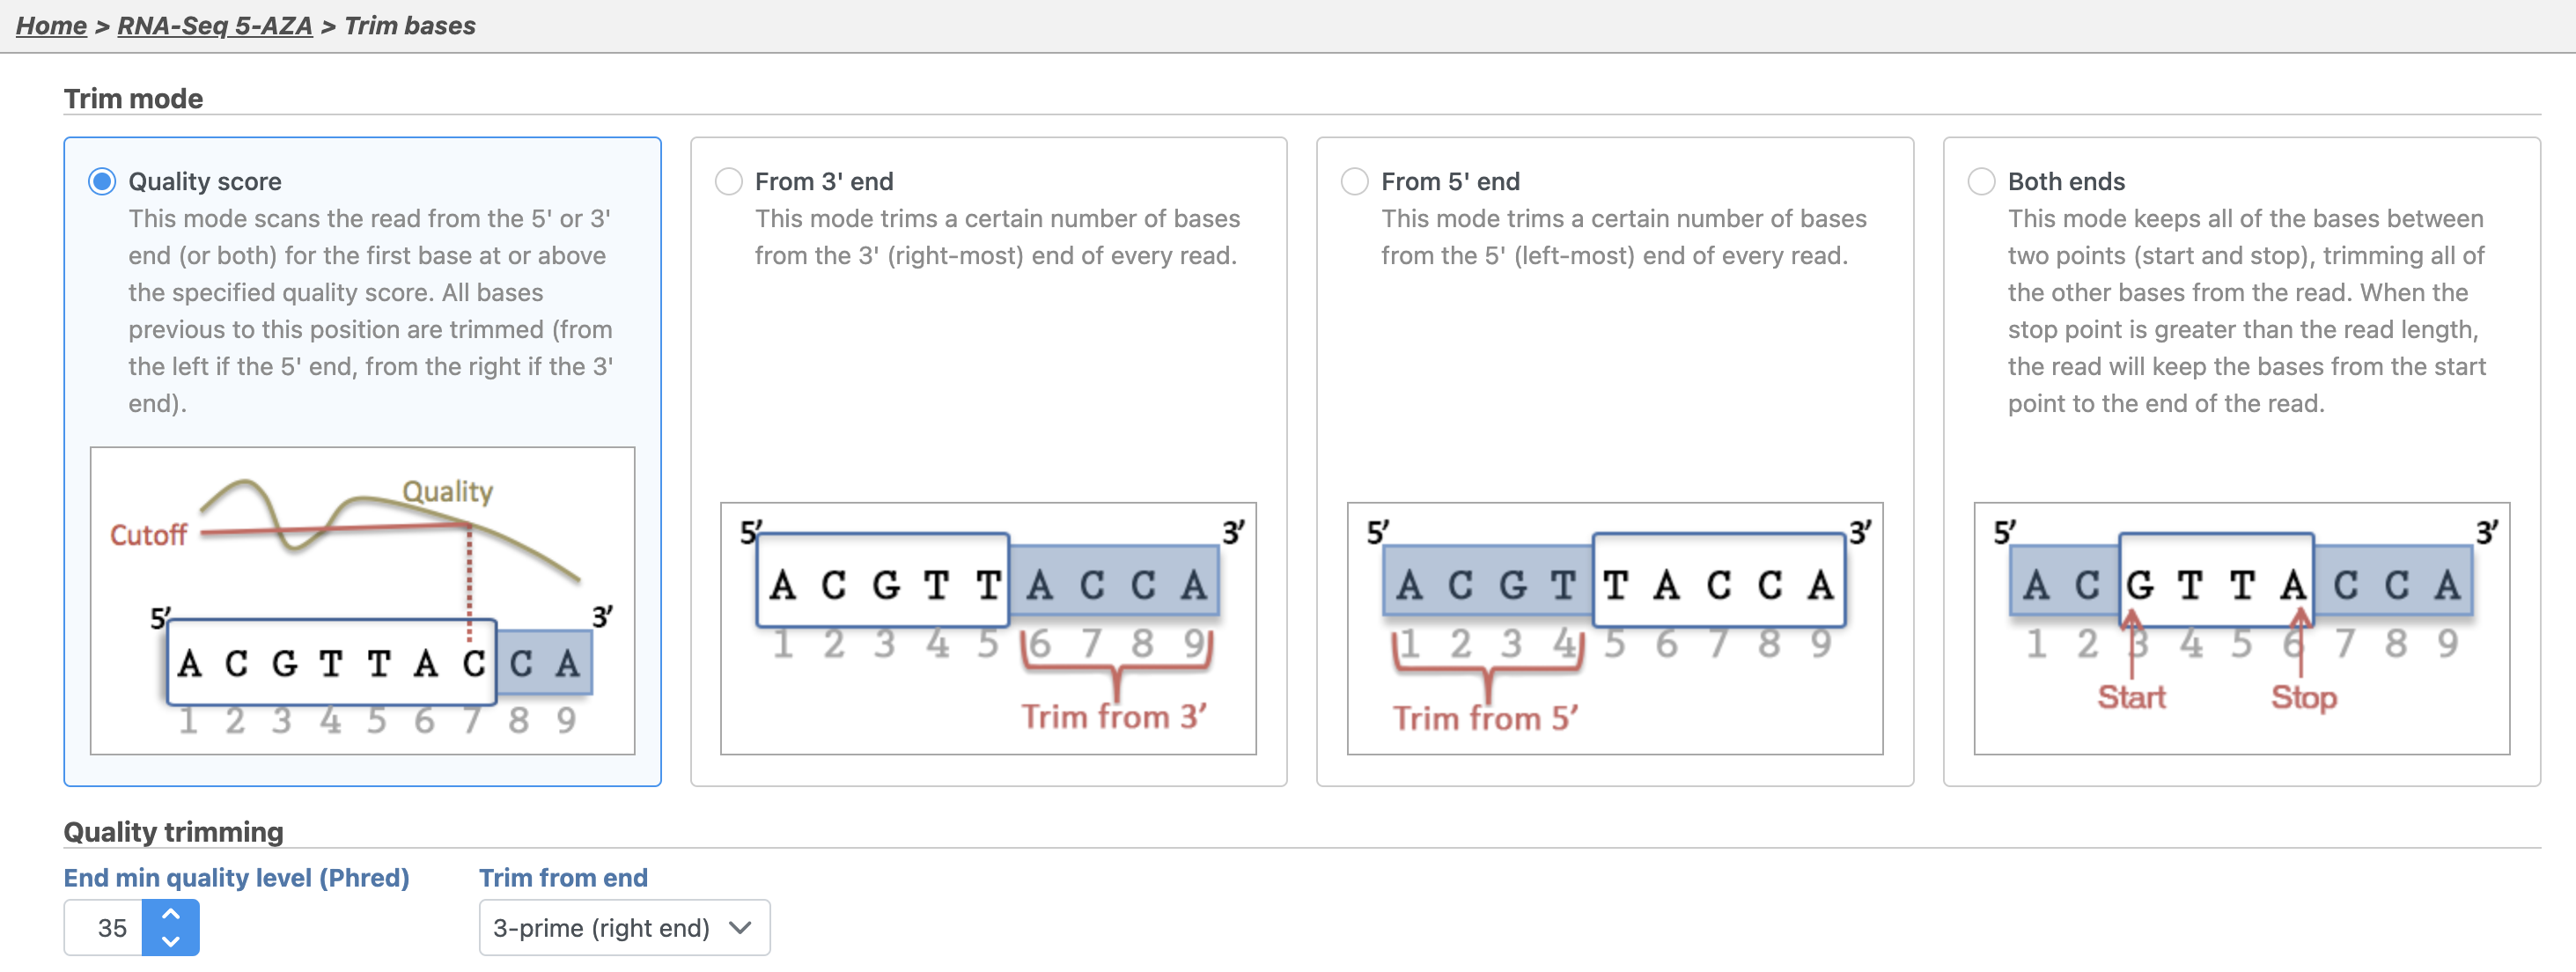
The Trim bases task will generate a new data node, Trimmed reads. While tasks have been queued or are in progress they have a lighter color. Any output nodes that the task will generate, such as the (Figure 3). We can view the task report for Trim bases by double-clicking either the Trim bases task node or the Trimmed reads data node from the Trim bases task, are also displayed in a lighter color until the task completes. Once the task begins running, a progress bar is displayed on the task node (Figure 3). or choosing Task report from the task menu.
...
| Numbered figure captions | ||||
|---|---|---|---|---|
| ||||
|
...
|
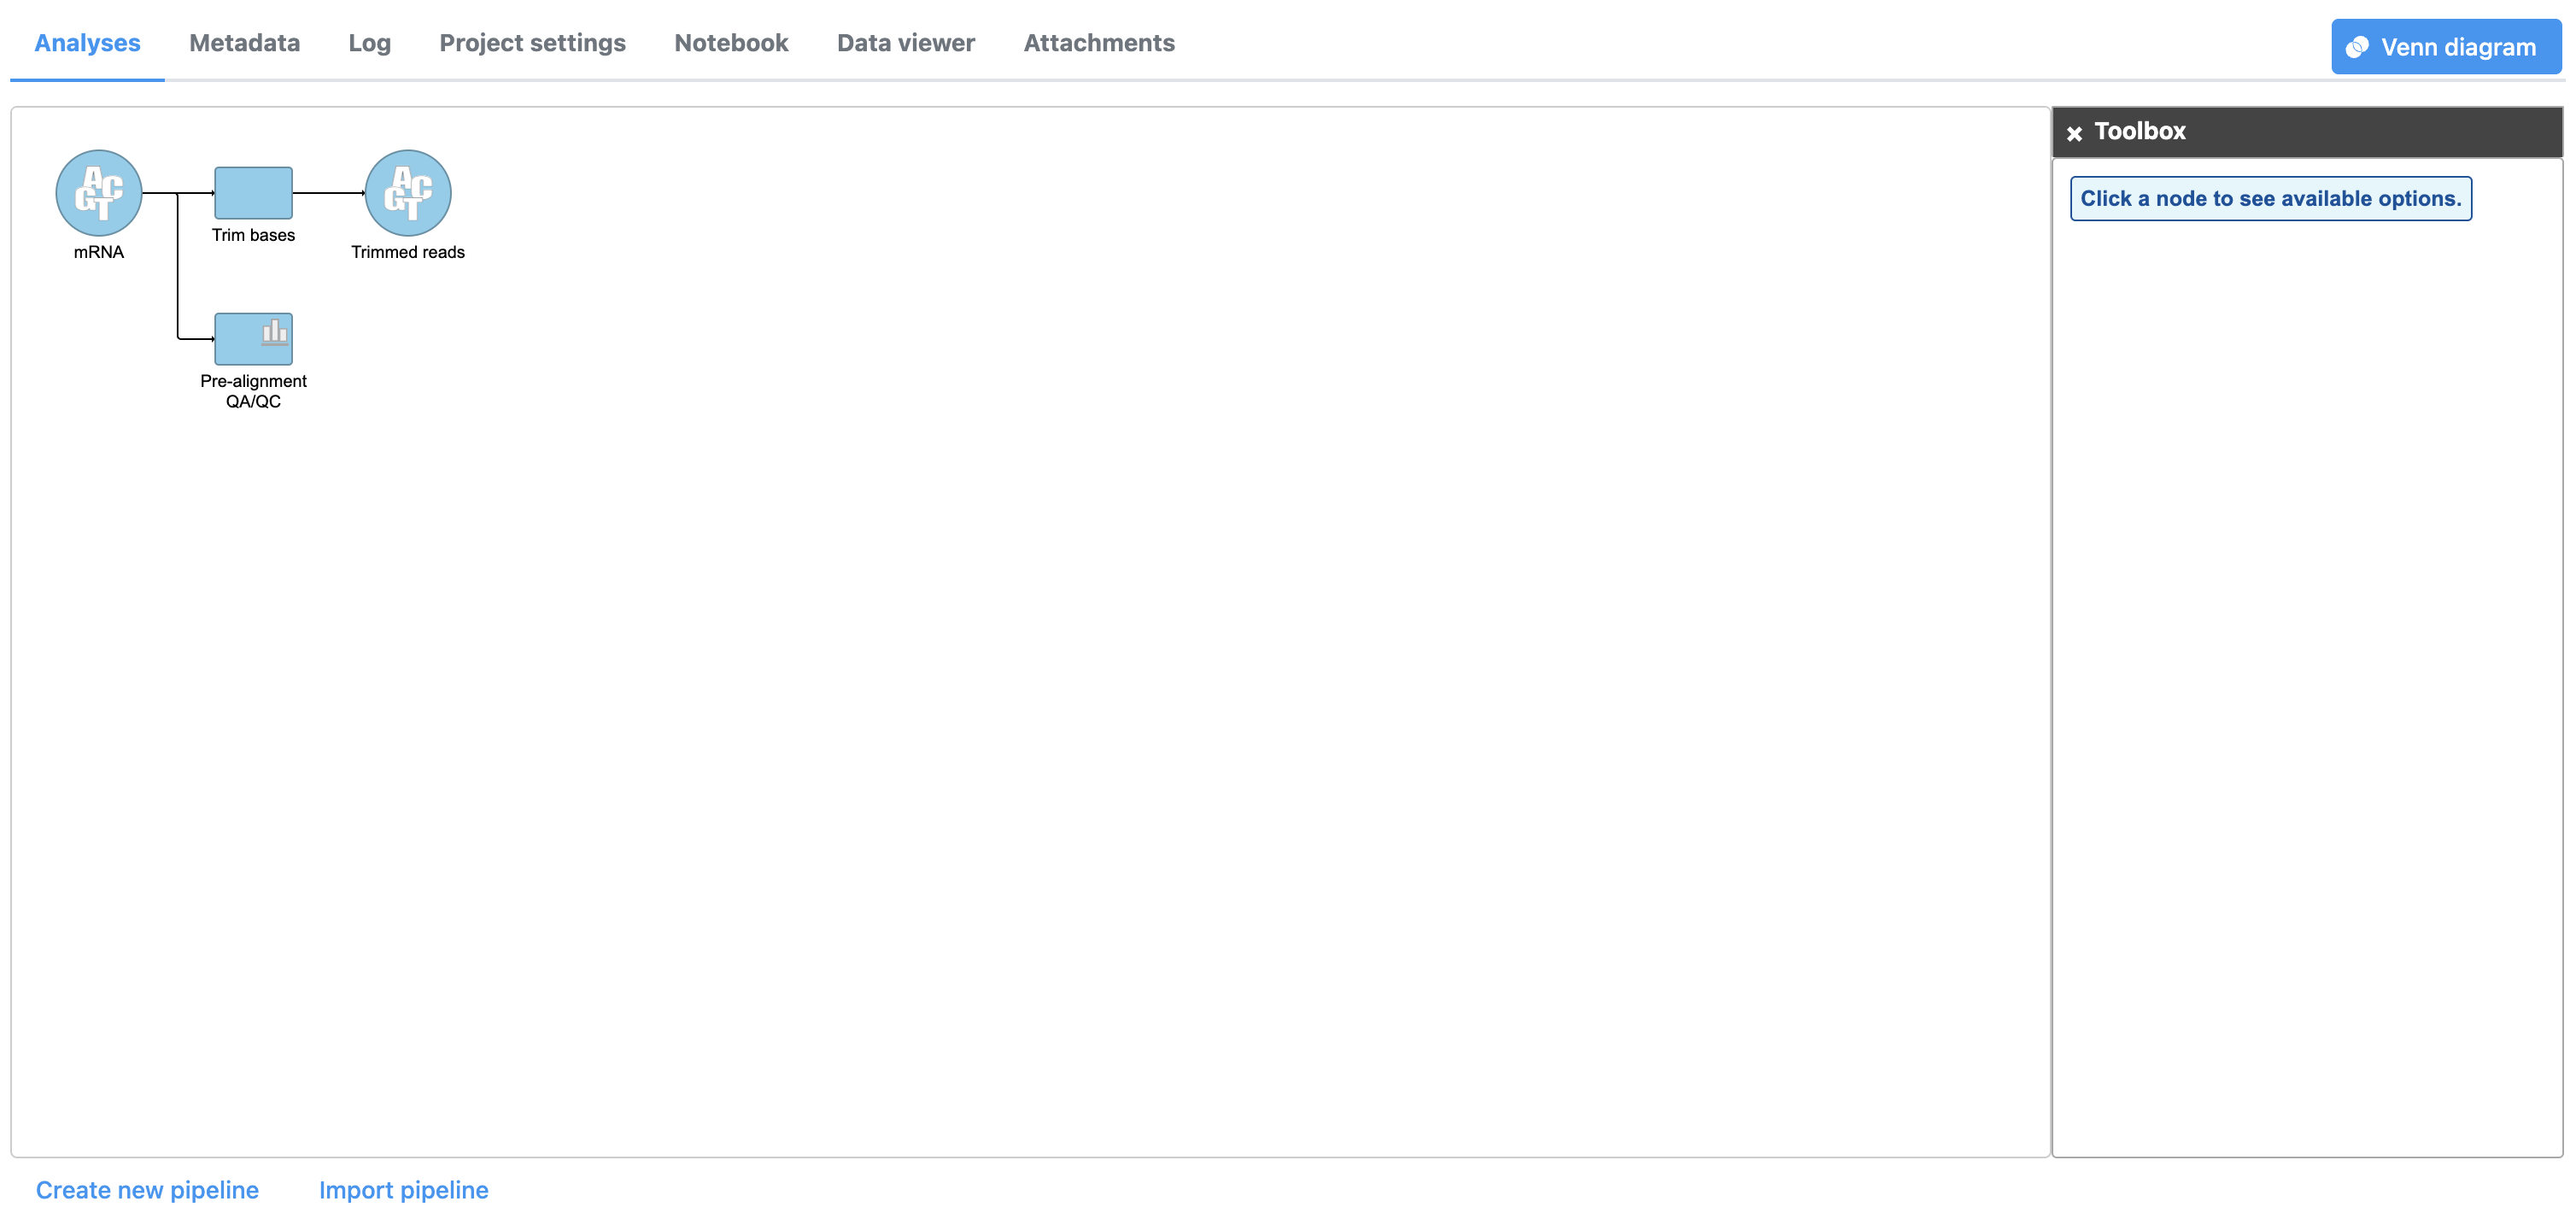
- Double-click the Trimmed reads data node Select Task report from to open the task menureport
The report shows the percentage of trimmed reads and reads removed in a spreadsheet (Figure 4) and a graph two graphs (Figure 54).
| Numbered figure captions | ||||
|---|---|---|---|---|
| ||||
|

| Numbered figure captions | ||||
|---|---|---|---|---|
| ||||
|

The average quality score for each base call at each position for each sample is also shown as a graph (Figure 6).
| Numbered figure captions | ||||
|---|---|---|---|---|
| ||||
|

...
|
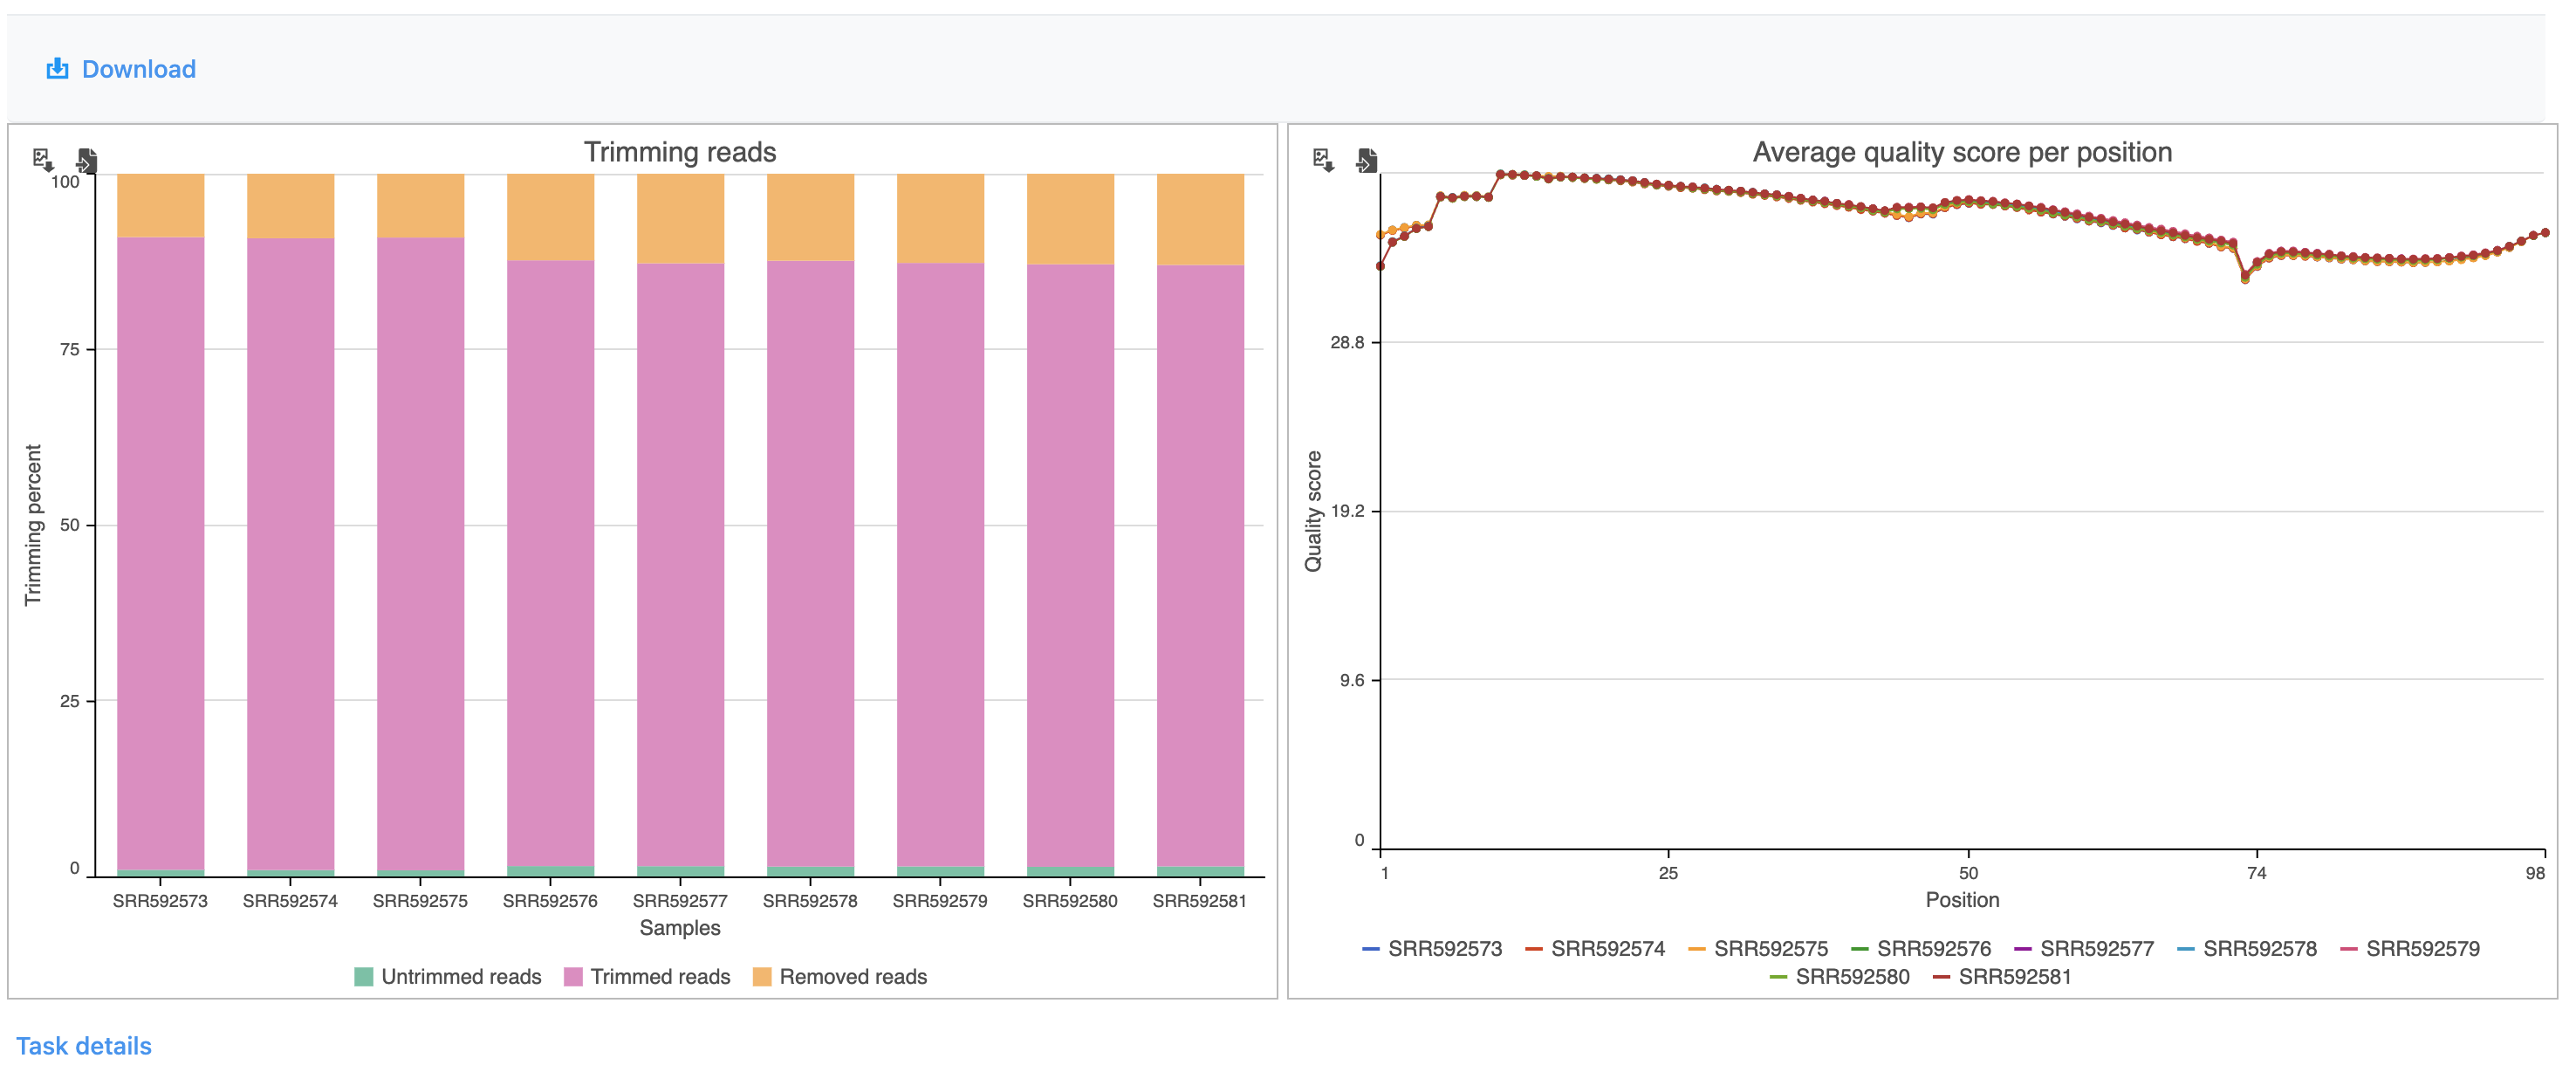
The results are fairly consistent across samples with ~65% ~2% of reads untrimmed, ~30% ~86% trimmed, and ~5% ~12% removed for each. The average quality score for each sample is increased with higher average quality scores at the 3' ends.
- Click RNA-Seq 5-AZA to return to the Analyses tab
| Page Turner | ||
|---|---|---|
|
| Additional assistance |
|---|
| Rate Macro | ||
|---|---|---|
|
...
Overview
Content Tools