Page History
| Table of Contents | ||||||
|---|---|---|---|---|---|---|
|
Opening a gene list as a child spreadsheet
Gene lists can be visualized and their ability to distinguish samples evaluated using a hierarchical clustering heat map. Because of the batch effect in this data set, we will perform hierarchical clustering using batch-corrected intensity values. To do this, we need to open the fourtreatments list of differentially expressed genes as a child spreadsheet of the batch-remove spreadsheet
...
Visualizations performed using the fourtreatments spreadsheet will now use intensity values from the batch-remove spreadsheet.
Hierarchical clustering using a gene list
To invoke hierarchical clustering, follow the steps below.
...
| Numbered figure captions | ||||
|---|---|---|---|---|
| ||||
|
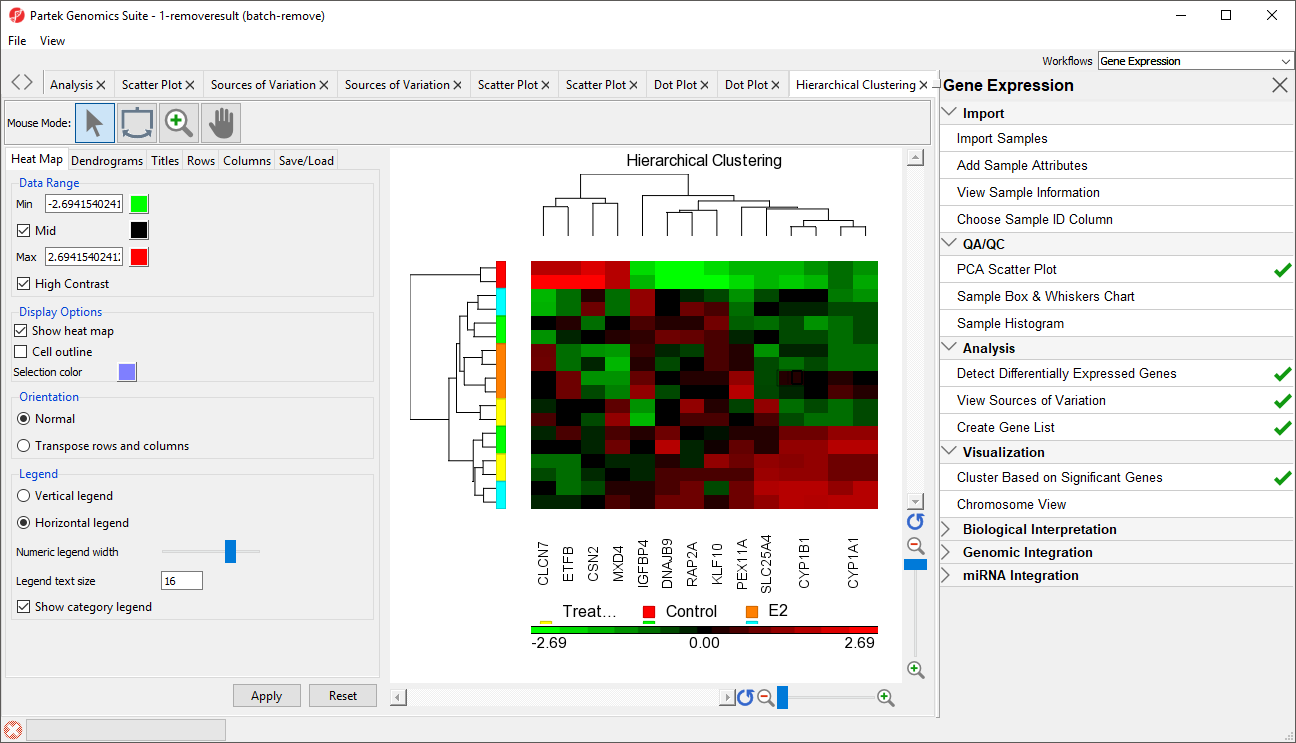
Genes, which are unchanged, are displayed as Genes without changes in expression are given a value of zero and are colored black. Up-regulated genes have positive values and are displayed in red. Down-regulated genes have negative values and are displayed in green. Each sample is represented in a row while genes are represented as columns. Dendrograms illustrate clustering of samples and genes. To learn more about configuring the hierarchical clustering heat map, see the Hierarchical Clustering Analysis user guide.
...
Overview
Content Tools