Page History
...
- Select ChIP-Seq from the spreadsheet tree
- Select Plot Chromosome View from the Visualization section of the ChIP-Seq workflow
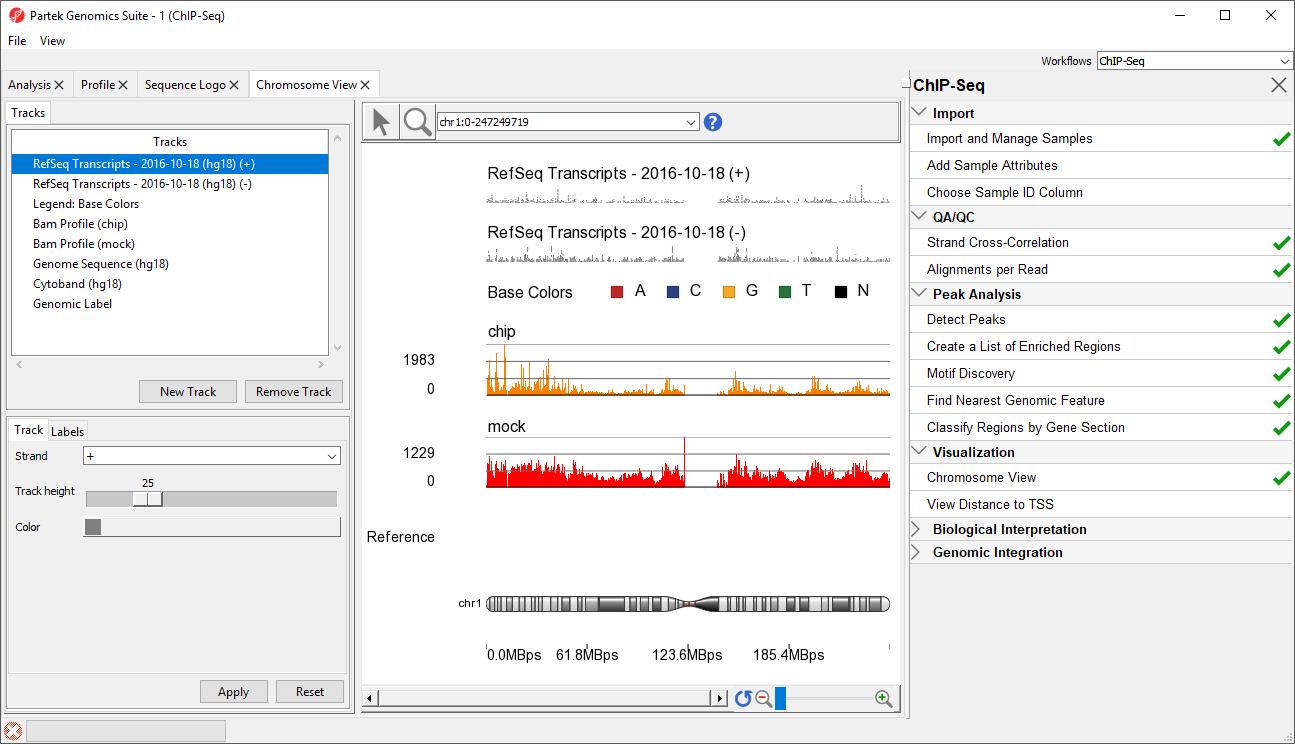
The Genome Viewer Chromosome View tab will open. The default tracks are the transcript tracks, the sequence visualization tracks, and the cytoband track (Figure 1).
...
| Numbered figure captions | ||||
|---|---|---|---|---|
| ||||
|

We can add additional tracks to view the results of our analysis.
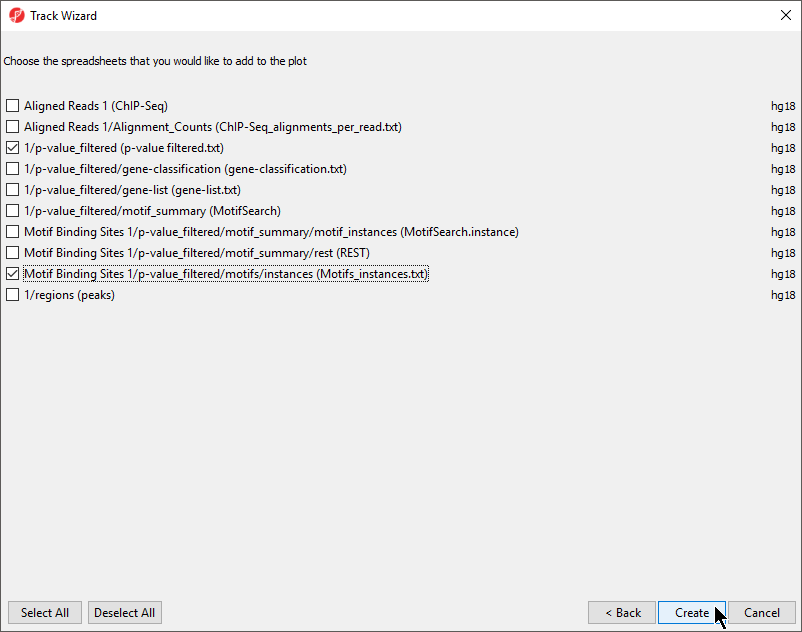
- Select New Track from the left-hand side of the Tracks tab
- Select Add tracks from a list of spreadsheets
- Select Next >
- Select the p-value_filtered.txt and Motifs_instances.txt tracks on the Tracks panel
- De-select Aligned Reads
- Select CreateCreate (Figure 2)
| Numbered figure captions | ||||
|---|---|---|---|---|
| ||||
|
This will display the enriched regions found in the samples and the locations of the motif instances from the de novo motif discovery (Figure 3).
| Numbered figure captions | ||||
|---|---|---|---|---|
| ||||
|

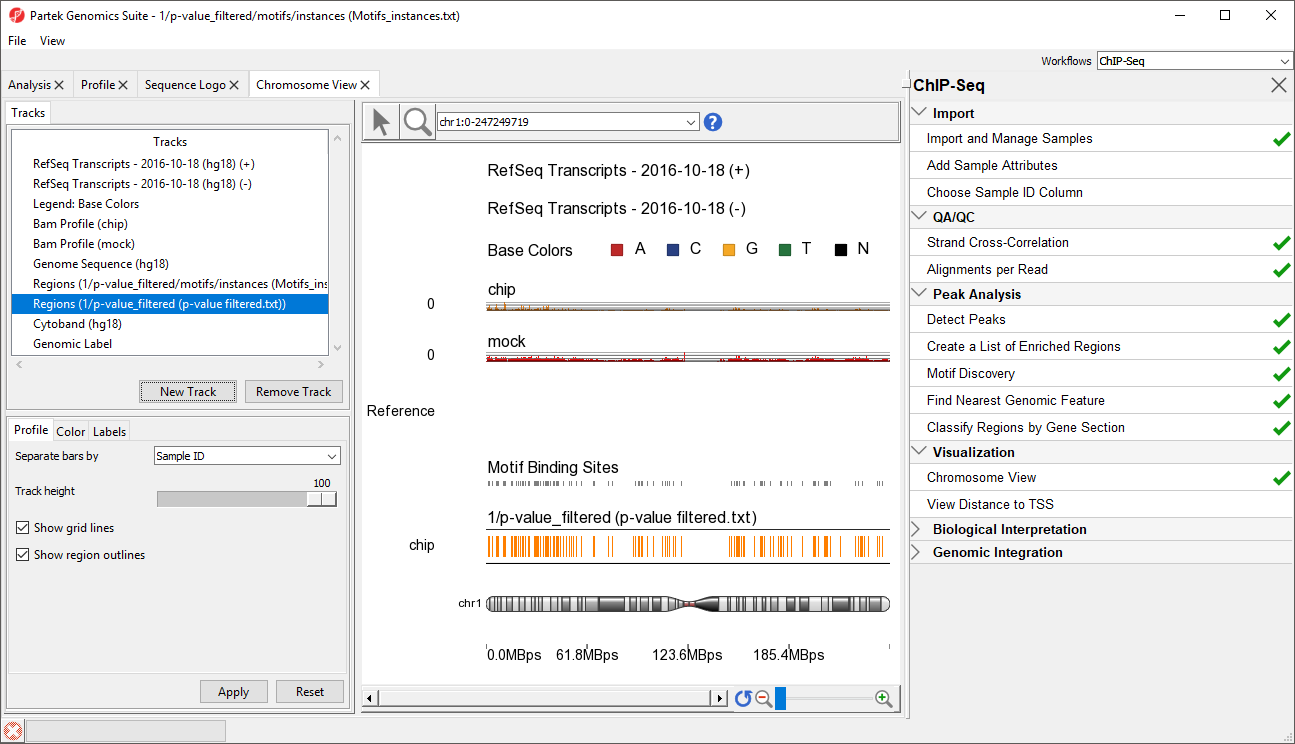
The two track display the detected regions at each location on the chromosome for the NRSF-enriched sample, chip, and aligned them to the de novo discovered motif binding sites. If you have not gone through the steps for peak detection and motif discovery, these tracks will not be available.
...
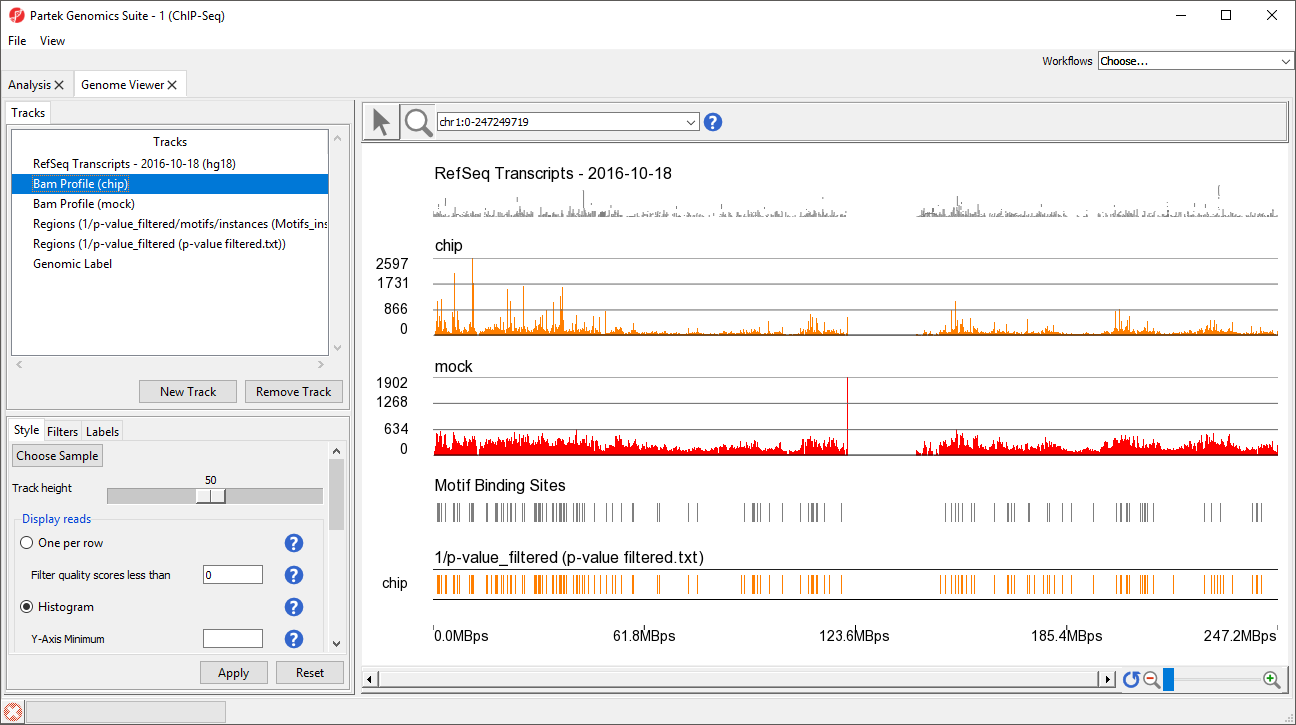
This view clearly shows the Bam Profile tracks for chip and mock samples alongside smaller track indicating motif binding sites, significant peaks, and RefSeq transcripts (Figure 34).
| Numbered figure captions | ||||
|---|---|---|---|---|
| ||||
|
...
- Left-click Legend: strands in the Tracks panel and drag it up the list to below Bam Profile (chip) (Figure 45)
| Numbered figure captions | ||||
|---|---|---|---|---|
| ||||
|
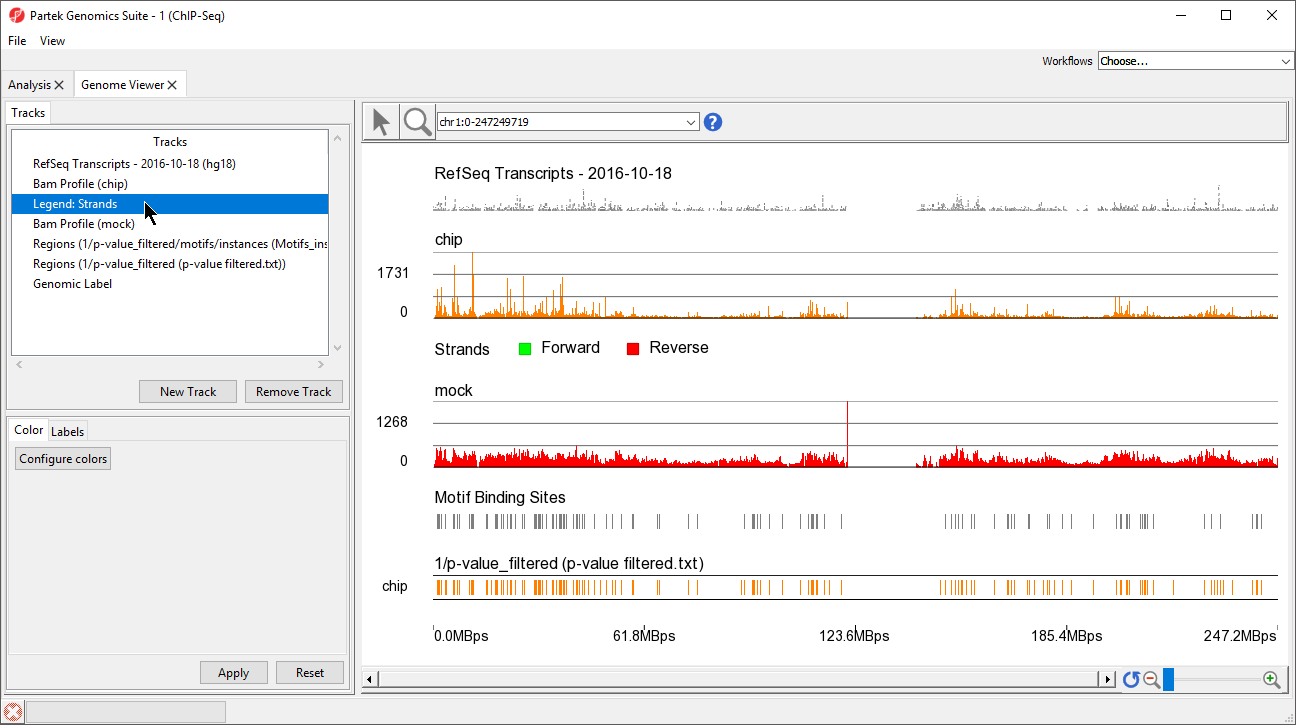
The Genome Viewer Chromosome View opens to a whole-chromosome view of chromosome 1. To analyze the data we can zoom in on the data (Figure 56).
| Numbered figure captions | ||||
|---|---|---|---|---|
| ||||
|

There are four methods for zooming in and out in the Genome Viewerin Chromosome View. (1) Select (![]() ) to activate Zoom/Navigate Mode. With this mode selected, left-clicking and drawing a box on a track will zoom to the region in the box. (2) Use the mouse scroll wheel (3) Select the zoom in (
) to activate Zoom/Navigate Mode. With this mode selected, left-clicking and drawing a box on a track will zoom to the region in the box. (2) Use the mouse scroll wheel (3) Select the zoom in (![]() ) and zoom out (
) and zoom out (![]() ) on the zoom controls (
) on the zoom controls ( ). Selecting (
![]() ) resets the zoom to whole chromosome. (4) Use the slider on the zoom controls (). (5) Zoom to a location or gene by typing the coordinates or gene name in the Navigation bar (
) resets the zoom to whole chromosome. (4) Use the slider on the zoom controls (). (5) Zoom to a location or gene by typing the coordinates or gene name in the Navigation bar ( ) and pressing Enter on your keyboard. (5) Starting on a spreadsheet, right-click a row with region information, and select Browse to Location.
...
- Type NEUROD1 in the navigation bar
- Select Enter on your keyboard to navigate to NEUROD1 (Figure 67)
| Numbered figure captions | ||||
|---|---|---|---|---|
| ||||
|

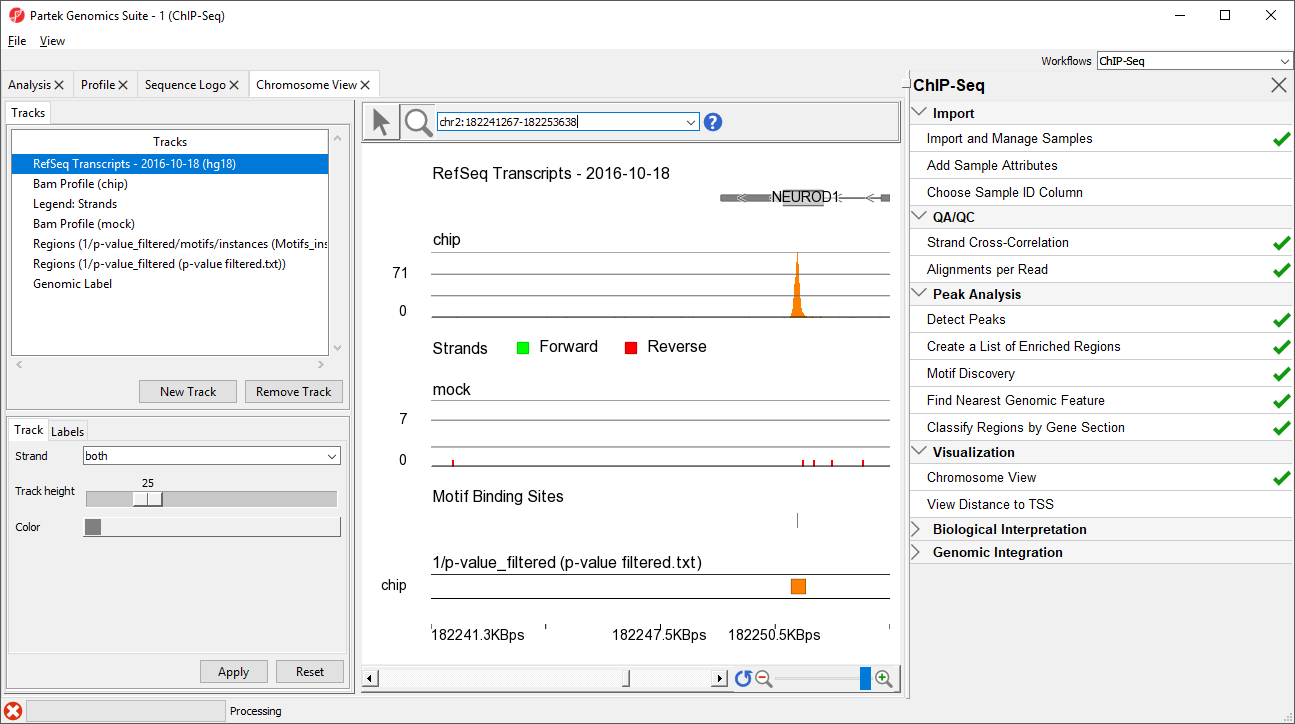
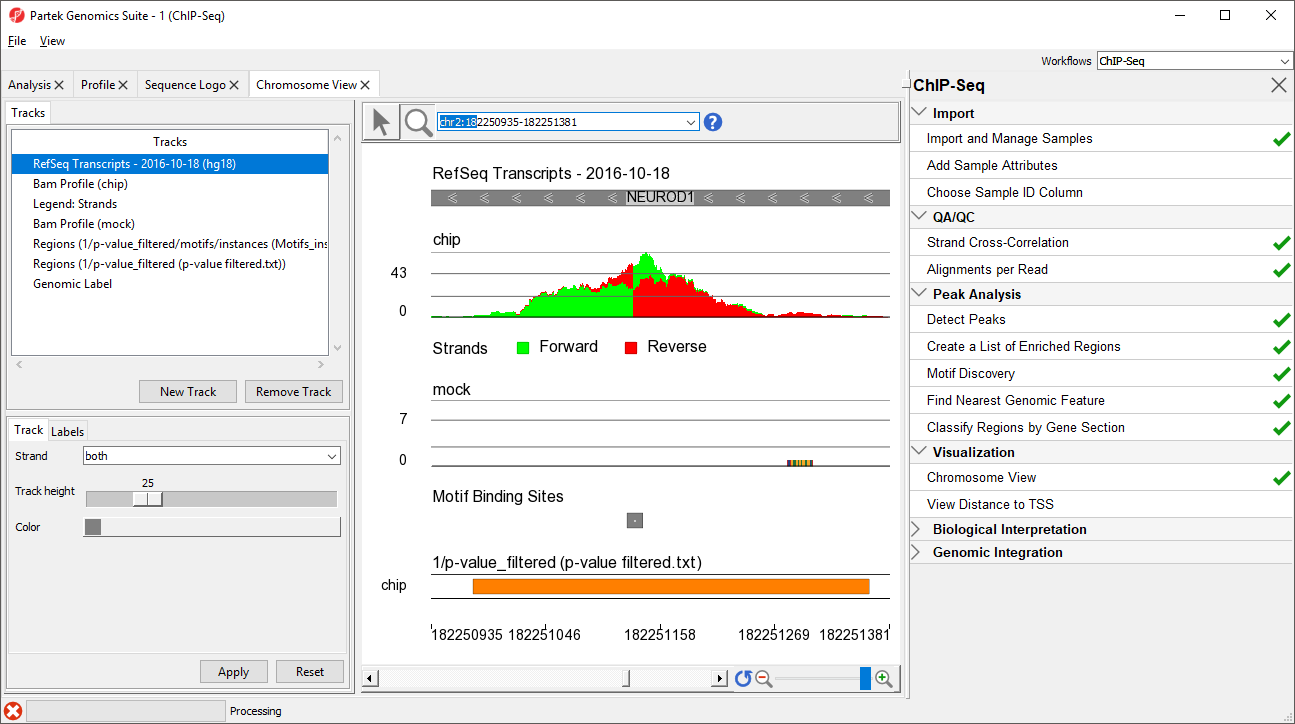
NEUROD1 contains a binding site for the NRSF motif. Notice that the enriched region for the NRSF transcription factor is within the NEUROD1 gene. As discussed in the Johnson et al. paper, NRSF is implicated in the repression of NEUROD1, but it was unknown exactly where the NRSF binding occurred. This data indicates that the binding site is within the NEUROD1 gene itself, as shown by the orange box in the Regions track. We can zoom in further to view the forward and reverse strand read histogram.
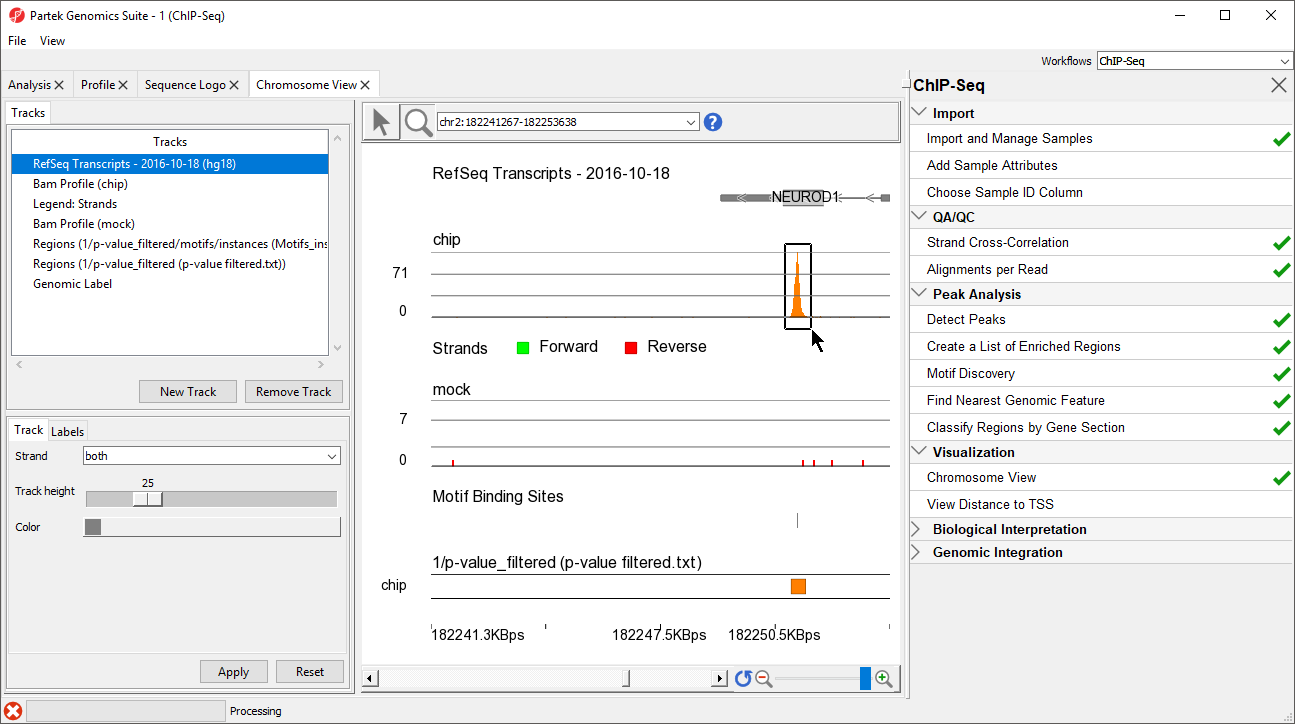
- Select (
 )
) - Left-click and drag to draw a box around the predicted binding site (Figure 78)
| Numbered figure captions | ||||
|---|---|---|---|---|
| ||||
|

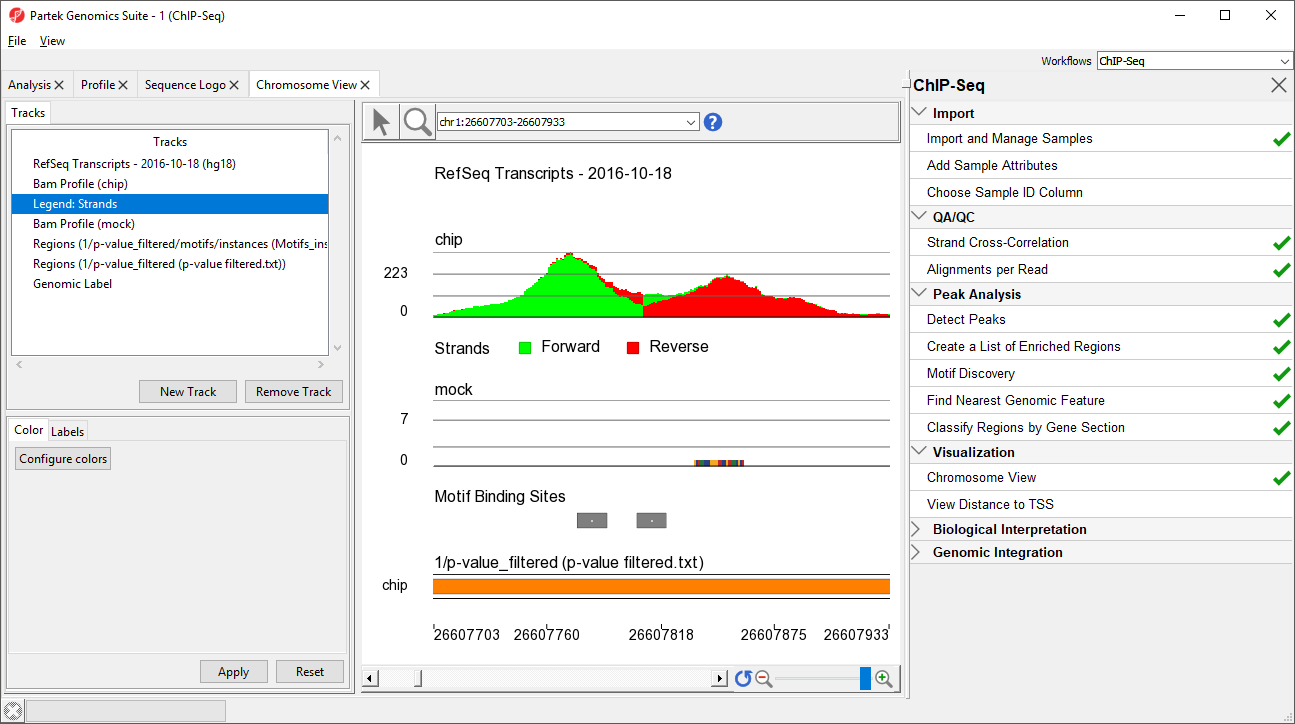
Zoomed-in further, we can see the intersecting peaks from forward and reverse strand reads (Figure 89).
| Numbered figure captions | ||||
|---|---|---|---|---|
| ||||
|

You can save the reads shown in the visible genome browser window by selecting (![]() ), right-clicking in the peak area on the Bam Profile track, and selecting Dump Displayed Reads to Spreadsheet from the pop-up menu.
), right-clicking in the peak area on the Bam Profile track, and selecting Dump Displayed Reads to Spreadsheet from the pop-up menu.
...
Overview
Content Tools