Page History
...
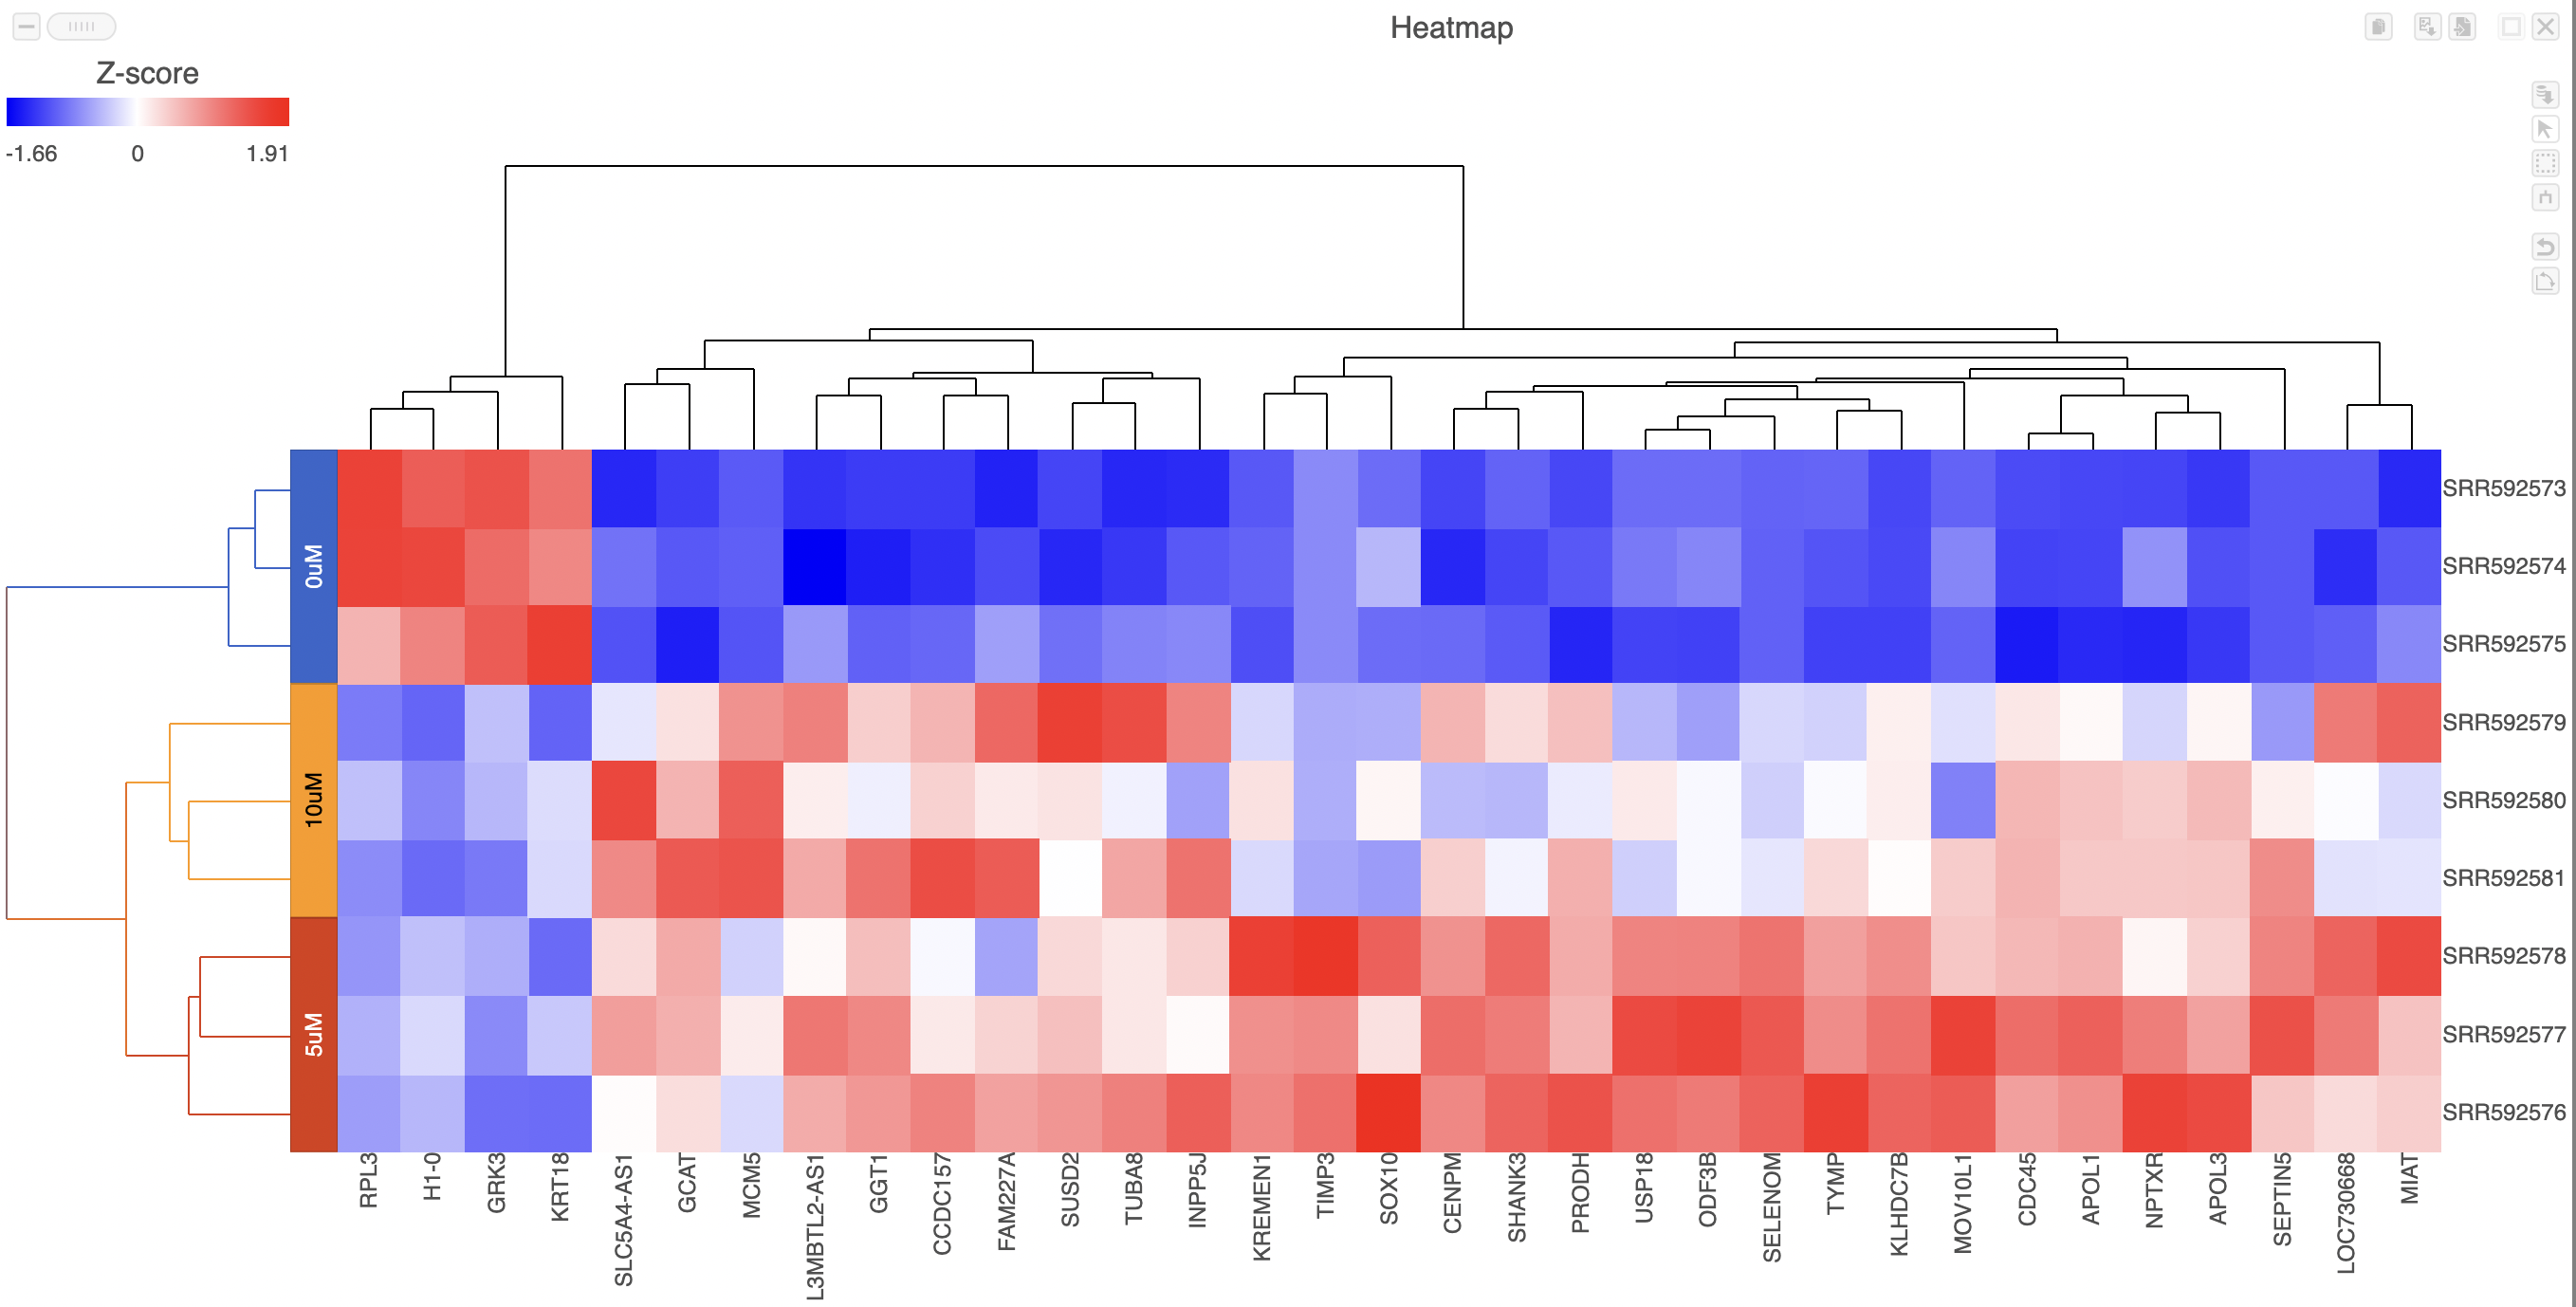
The heatmap can be customized to improve data visualization using the menu on the Configuration panel on the left. You can select Annotations to choose the appropriate attribute to annotate the rows, as well as coloring the dendogram using the Dendogram Dendograms menu. The color palette used to viusalize gene expression can be modified by accessing the Heatmap menu menu on the left and selecting the colors to be used from the sliding bar (Figure 4). (Figure 2).
...
| Numbered figure captions | ||||
|---|---|---|---|---|
| ||||
|
ghjkl
Click the Save image button ![]() to save a PNG or SVG image to your computer.
to save a PNG or SVG image to your computer.
Click the Send to notebook button ![]() to send the image to a page in the Notebook.
to send the image to a page in the Notebook.
ghjkl
ghjkl
ghjkl
| Additional assistance |
|---|
Overview
Content Tools