Page History
...
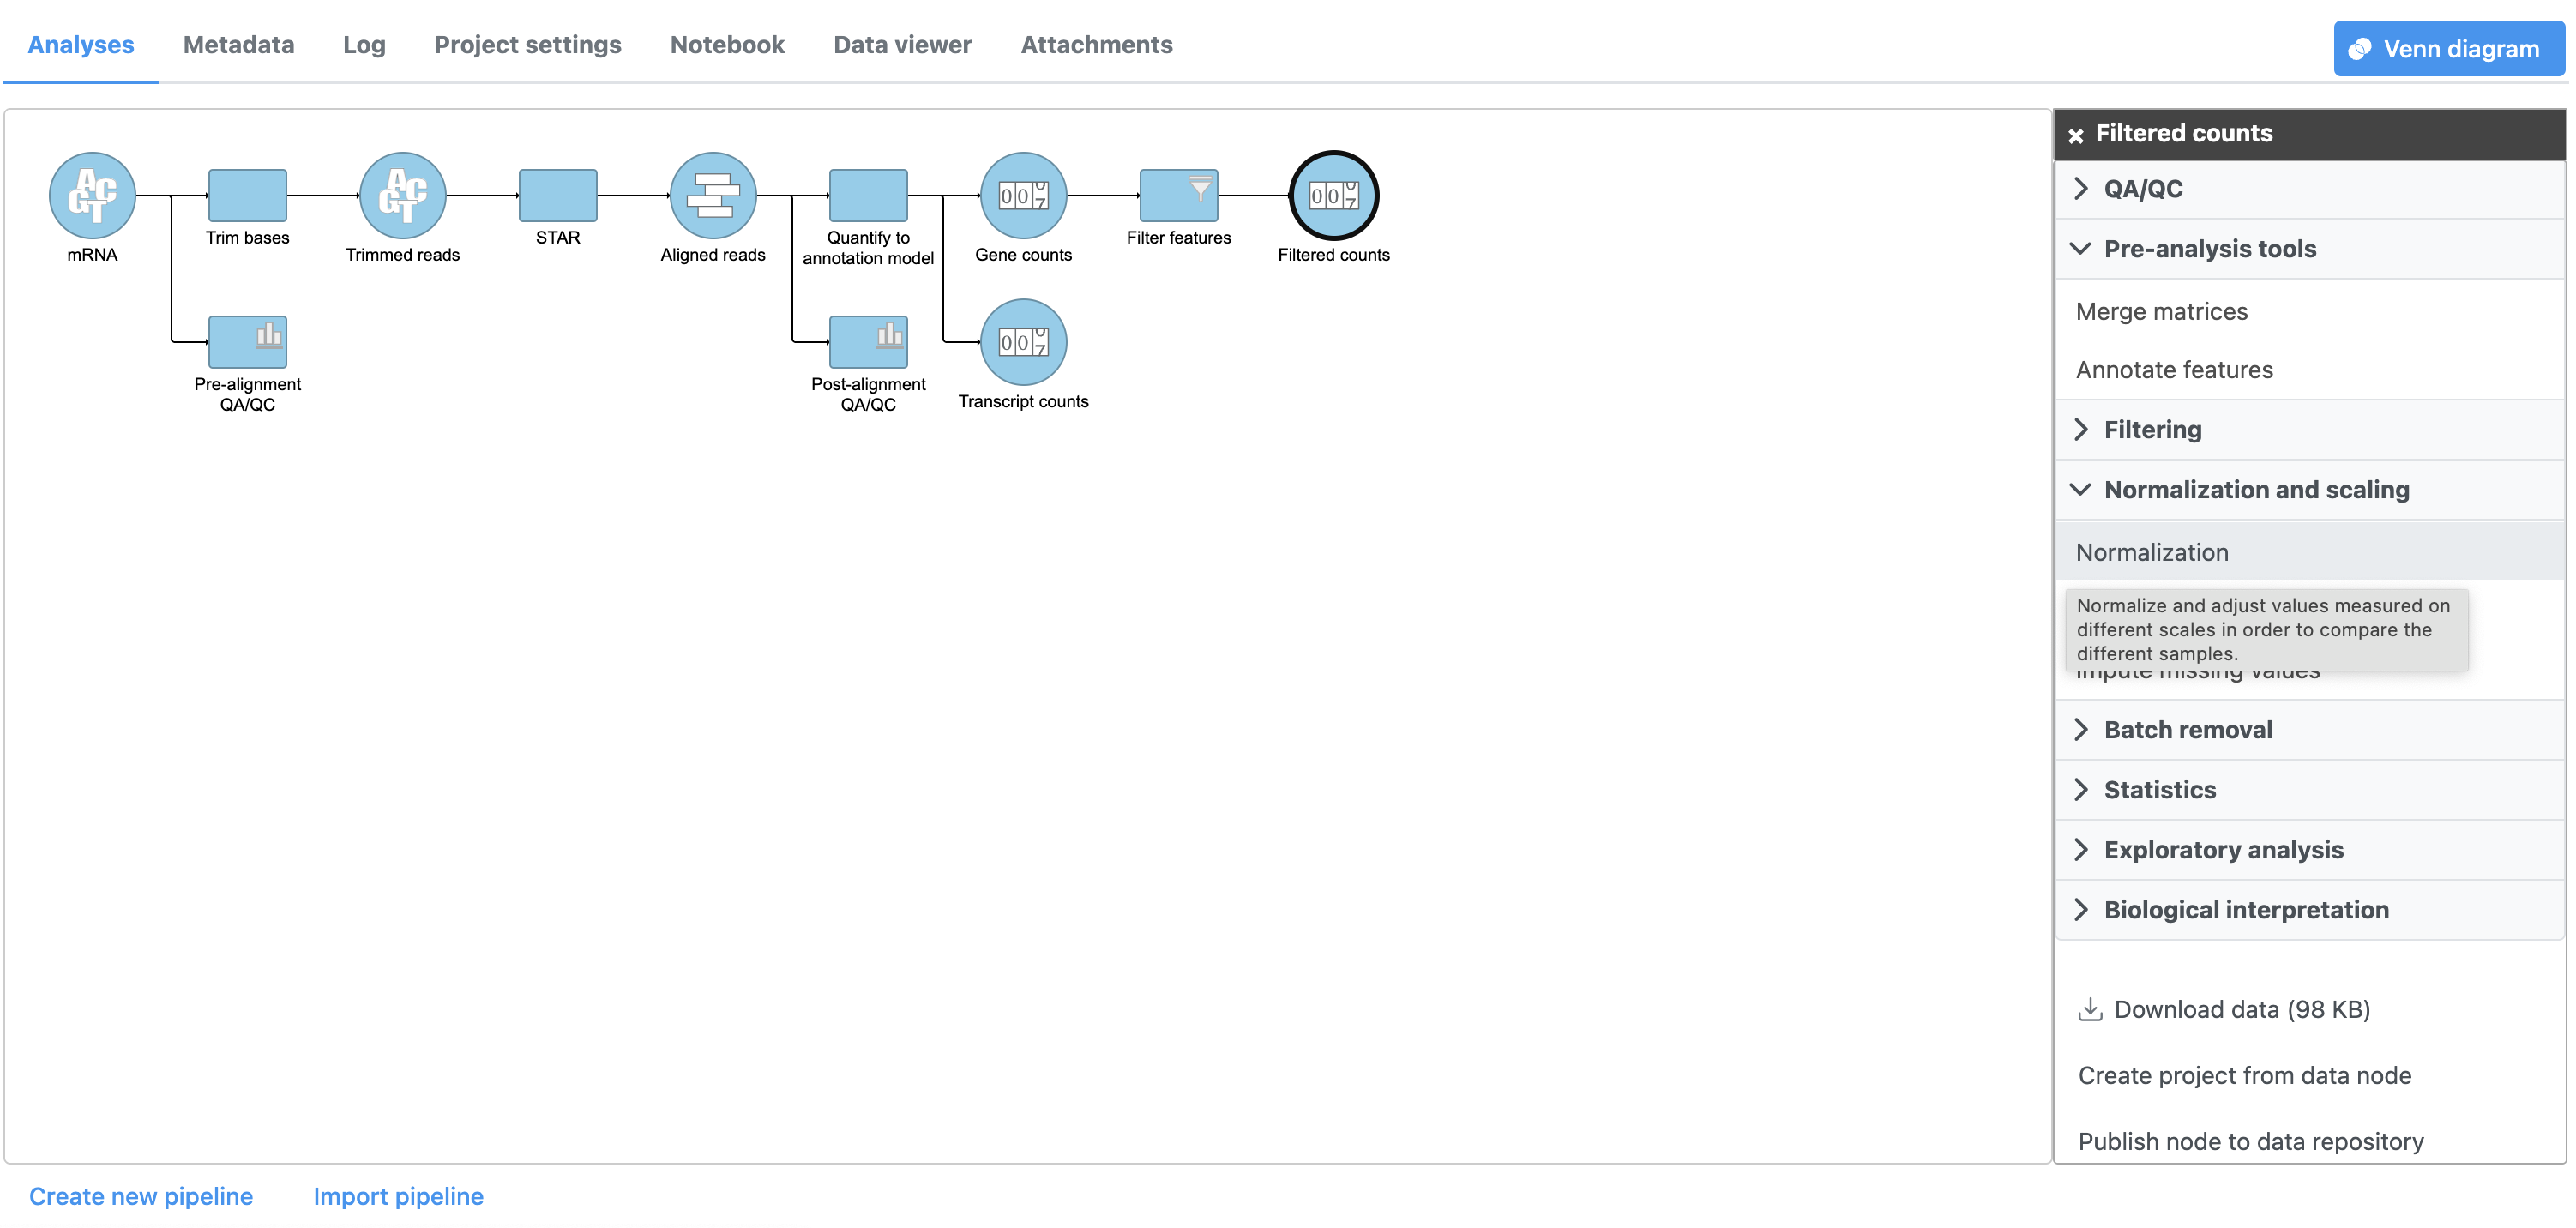
- Click the Filtered counts data node
- Click Normalization and scaling in the task menu
- Click Normalize counts Normalization (Figure 1)
| Numbered figure captions | ||||
|---|---|---|---|---|
| ||||
|

The Read count Count normalization menu will open (Figure 2).
| Numbered figure captions | ||||
|---|---|---|---|---|
| ||||
|

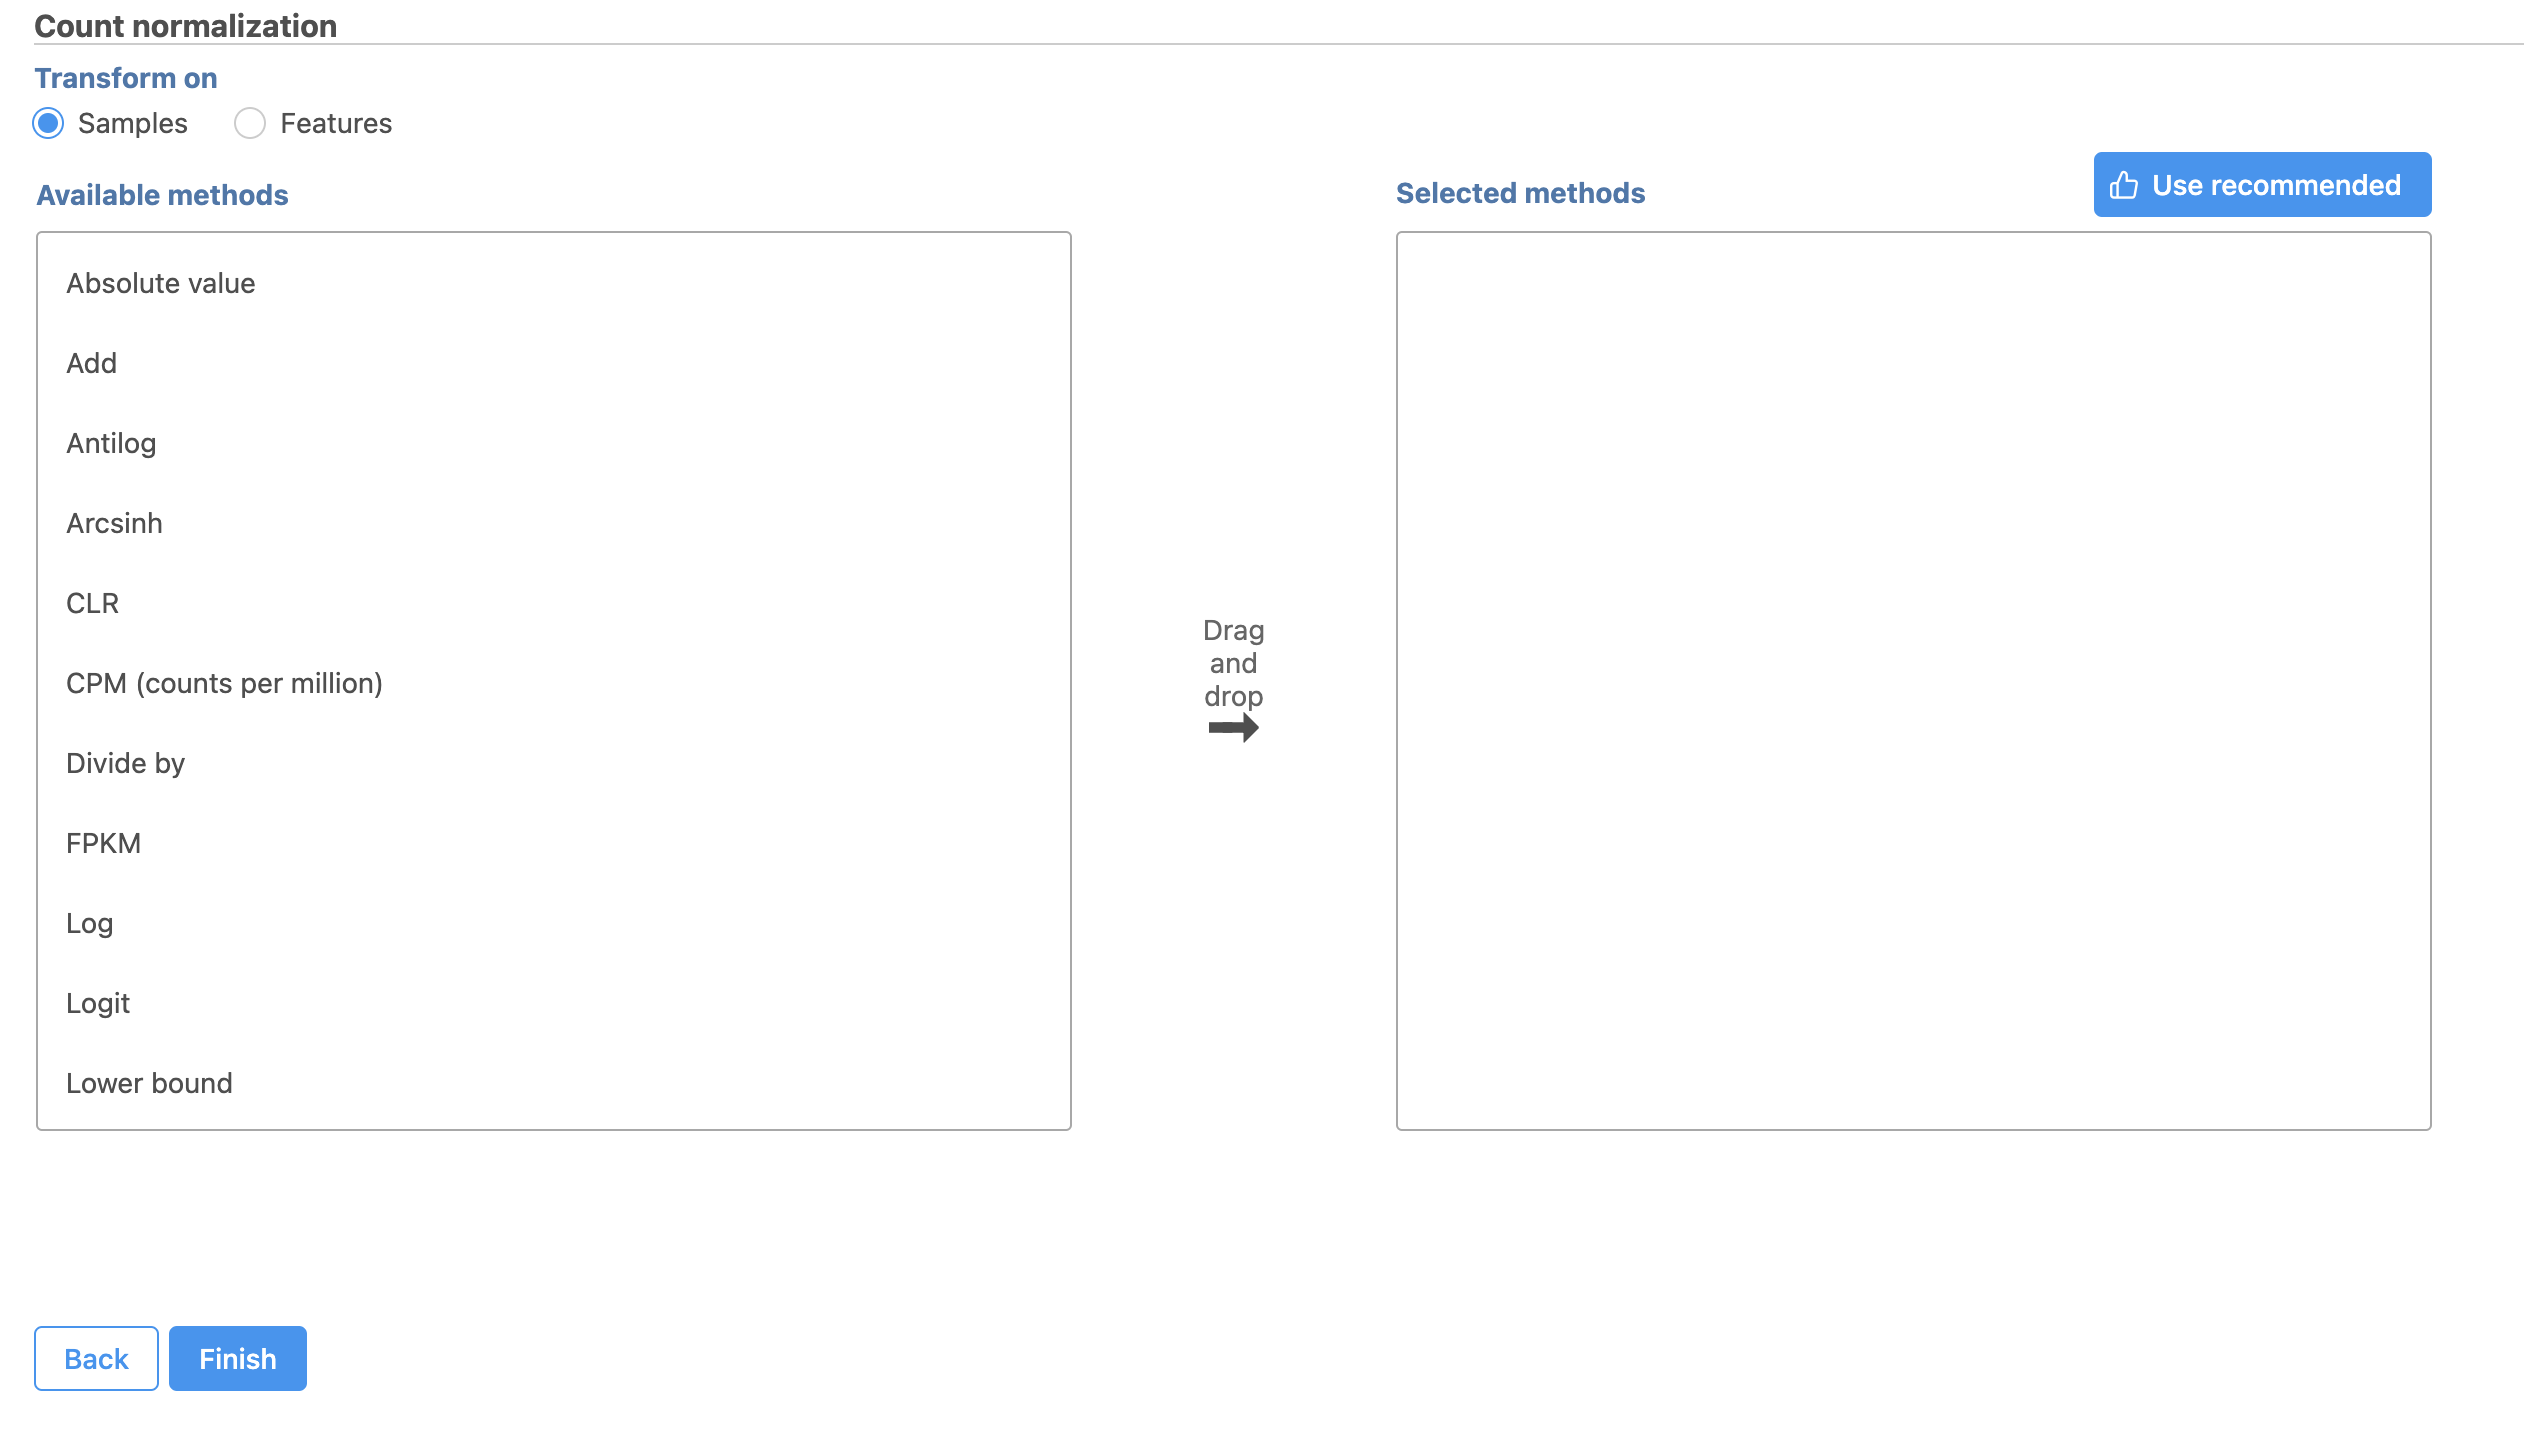
Normalization can be performed by sample or by feature. By sample is selected by default; this is appropriate for the tutorial data set.
Available normalization methods are listed in the left-hand panel. For more information about these options, please see the Normalize Countscounts user guide.
For this tutorial, we will use the recommended default normalization settings.
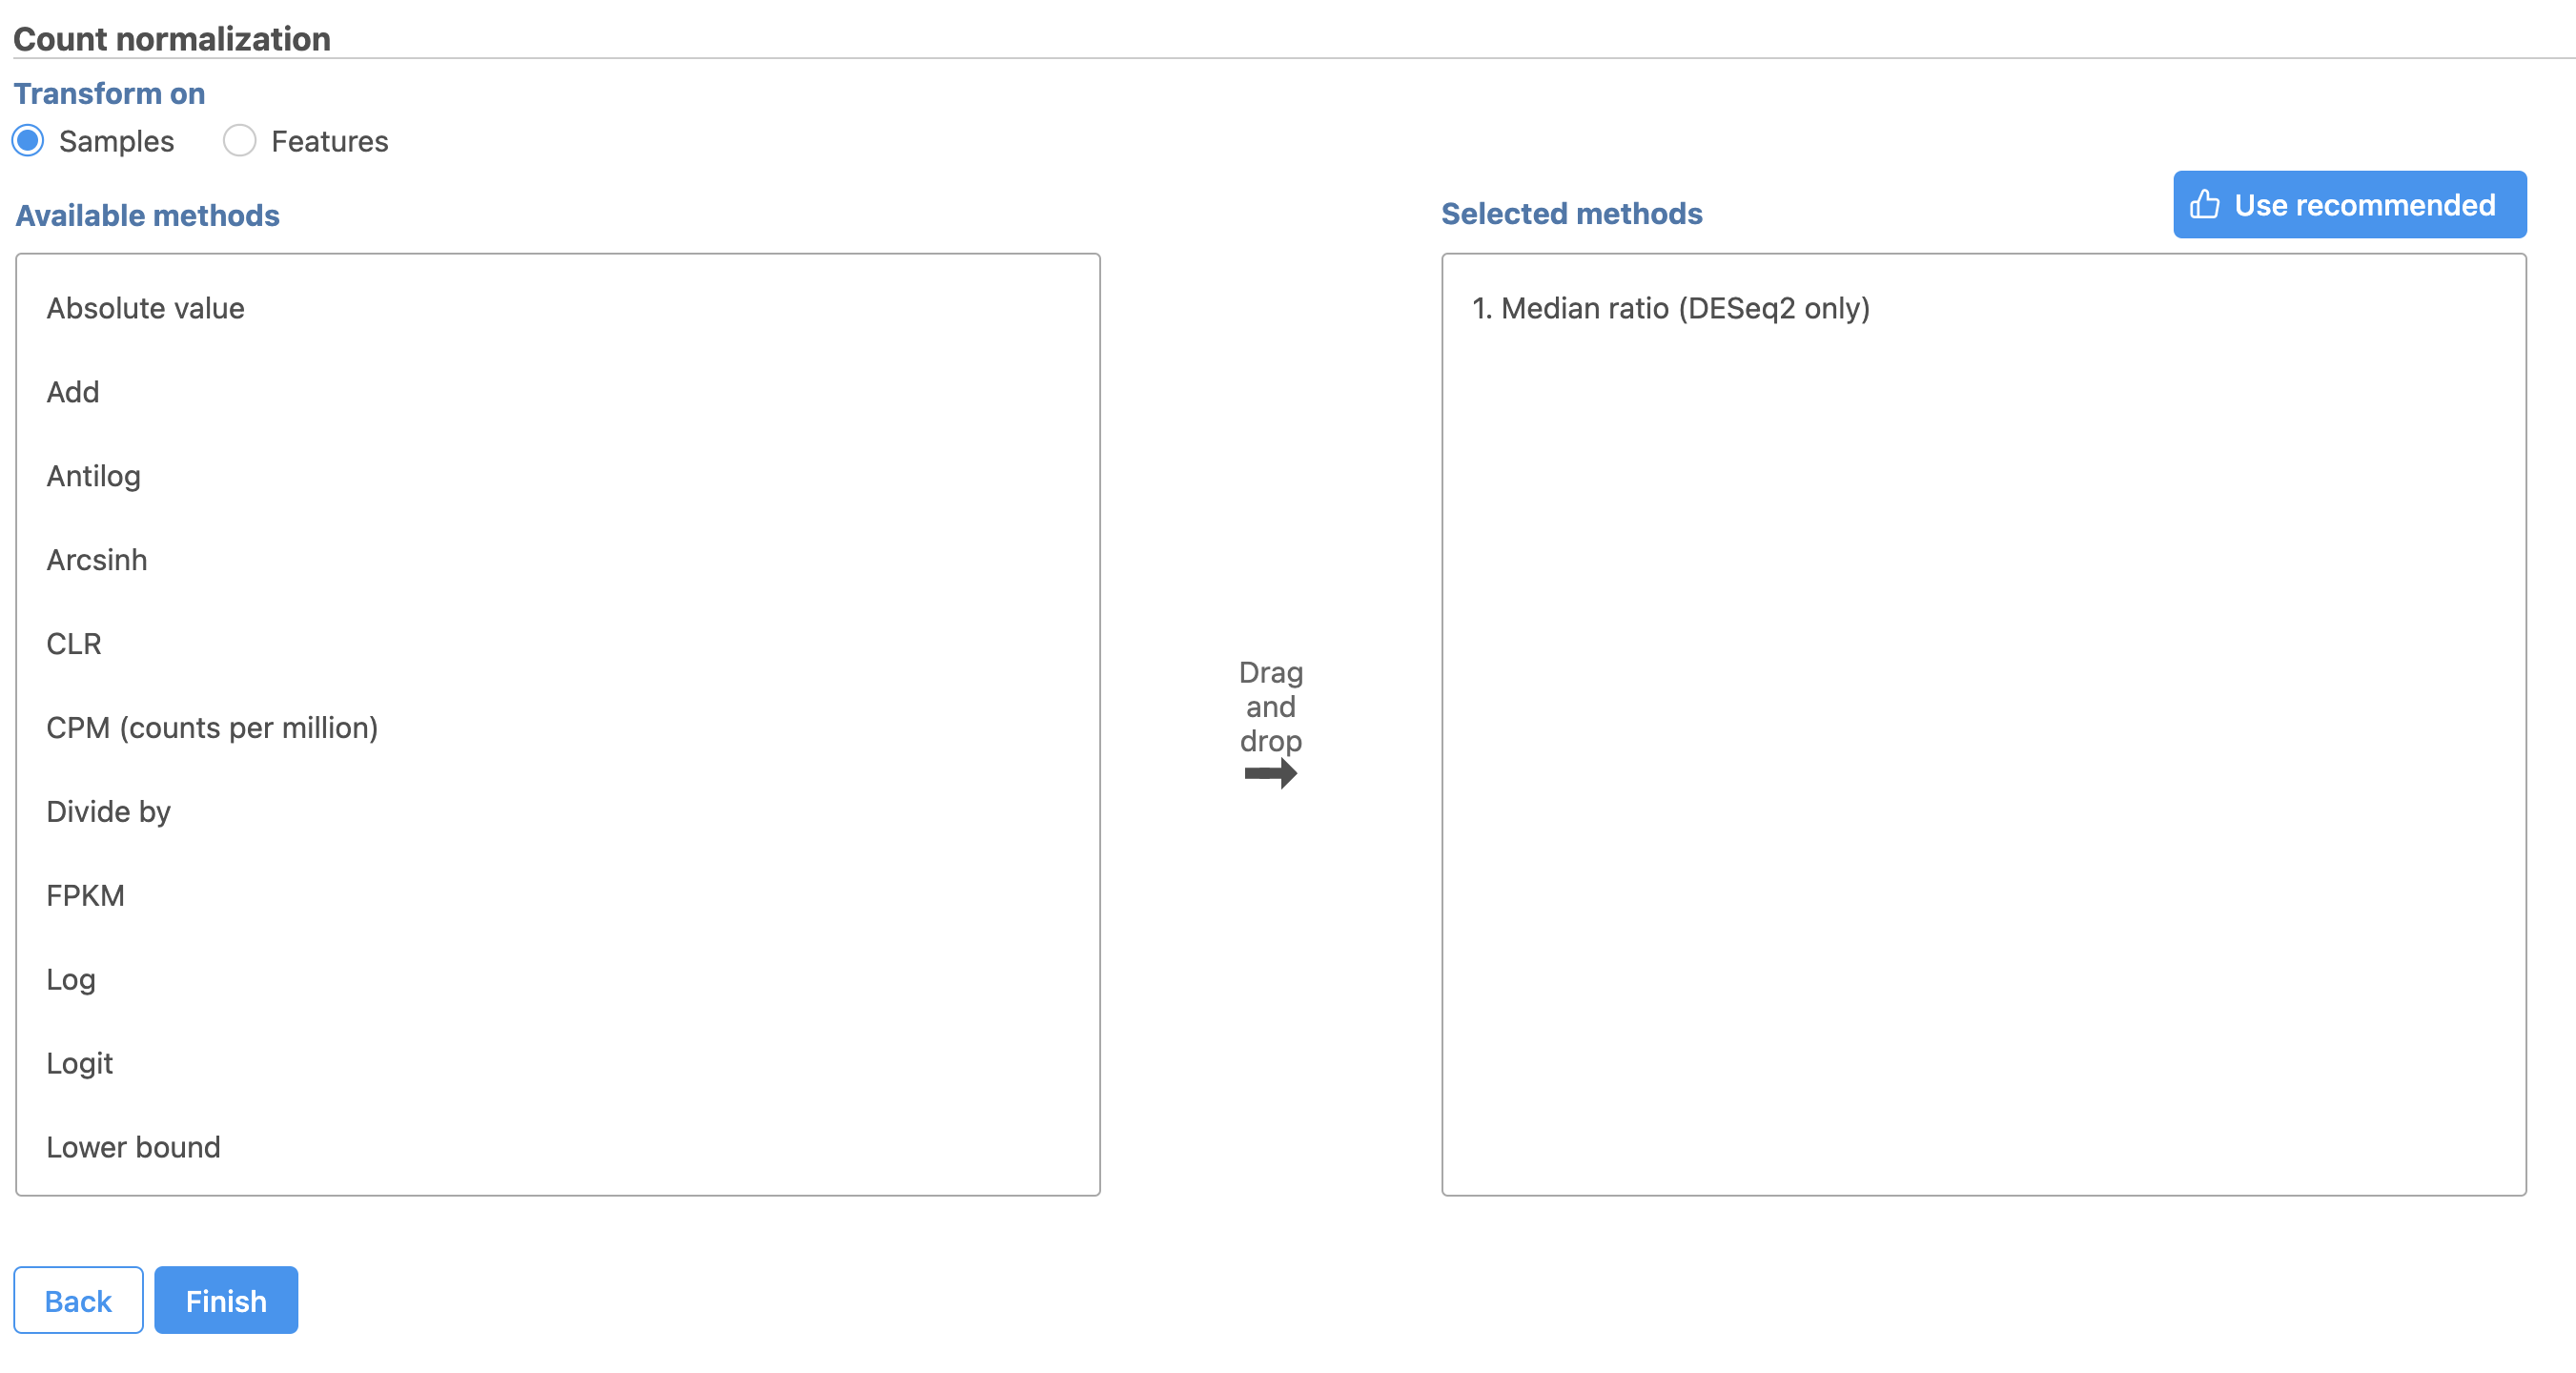
- Select

This adds Total count and Add 0.0001 to the Normalization order panel adds the Median ratio normalization method, which is suitable for performing differential expression analysis using DESeq2 (Figure 3). Normalization steps are performed in descending order
| Numbered figure captions | ||||
|---|---|---|---|---|
| ||||
|

Total Count normalizes read counts for each gene by the total count of the sample. This accounts for differences in total read counts between samples.
Add 0.0001 adds 0.0001 to the normalized read count of every gene. This prevents the read count data from having any 0 values. Values of 0 would prevent the gene specific analysis algorithm we will use for differential expression analysis from performing the necessary log transformation.
|
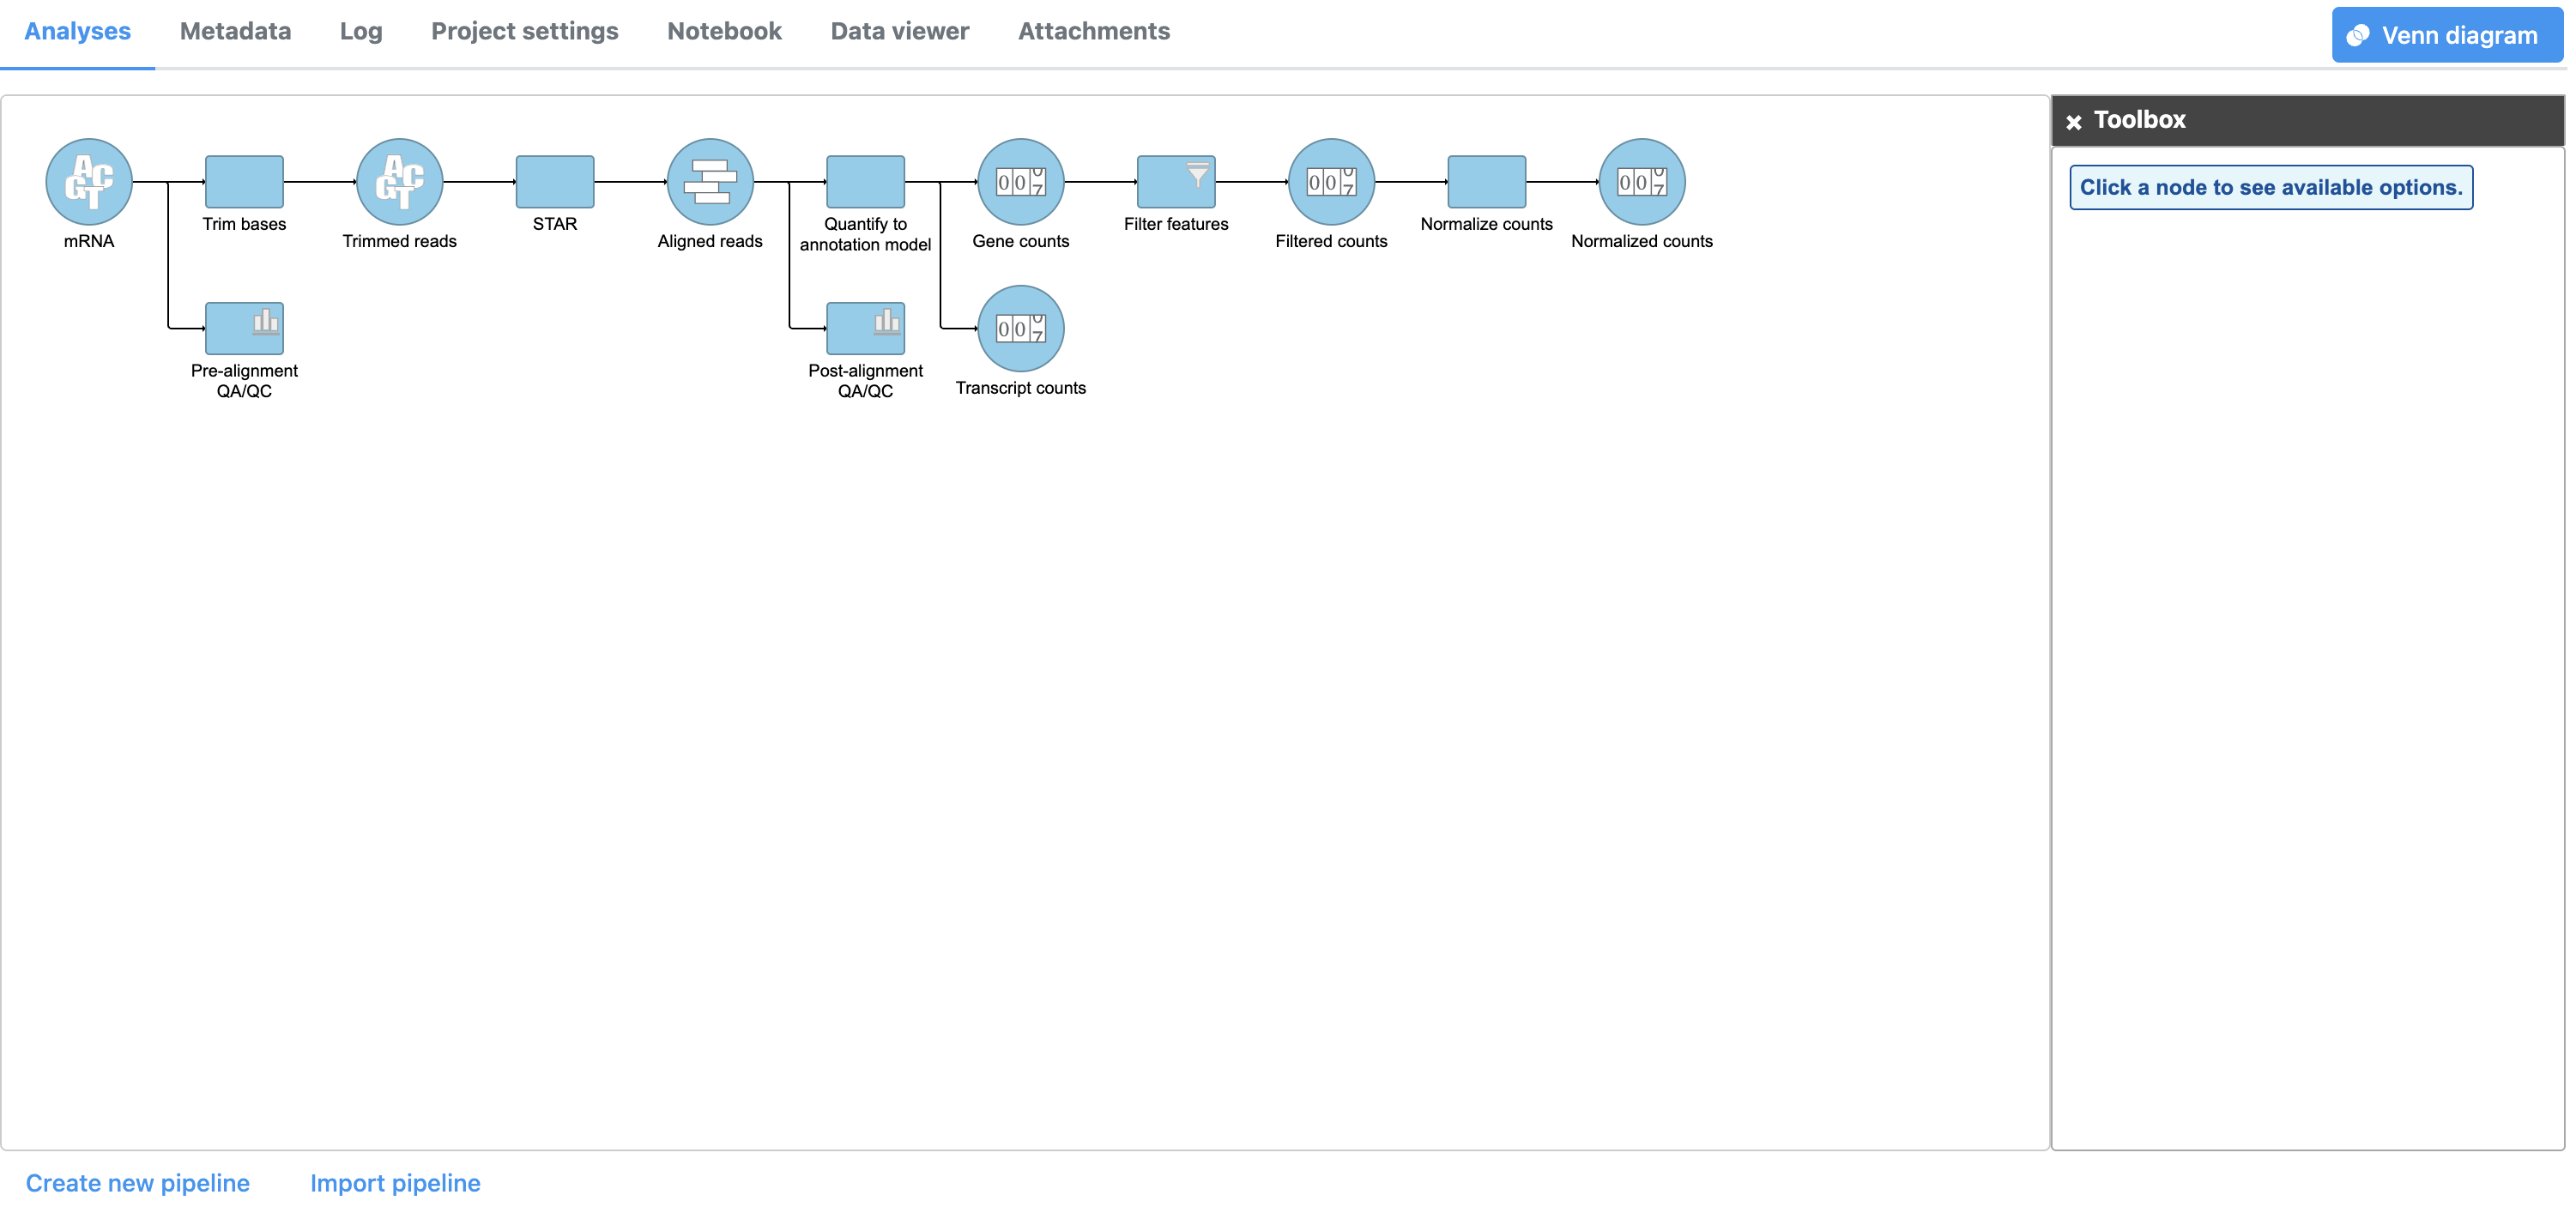
- Click Finish to perform normalization
A Normalize counts task node and a Normalized counts data node are added to the pipeline (Figure 4)
| Numbered figure captions | ||||
|---|---|---|---|---|
| ||||
|

| Page Turner | ||
|---|---|---|
|
| Additional assistance |
|---|
| Rate Macro | ||
|---|---|---|
|
...
Overview
Content Tools