Page History
...
If there is more than one factor in the model, more complex criteria combining the factors can be specified using the gene list creator. The Create Gene List tool is available under the Analysis section of the workflow. Tools>List Manager menu Advanced tab. For example, to find categories that are significant and changed by at least two fold, make two criteria, : one for a low p-value and the other for a minimum of two fold change, and take the intersection of the two . This is the only way to analyze GO ANOVA if no factor is interacted with genes.criteria.
| Numbered figure captions | ||||
|---|---|---|---|---|
| ||||
|
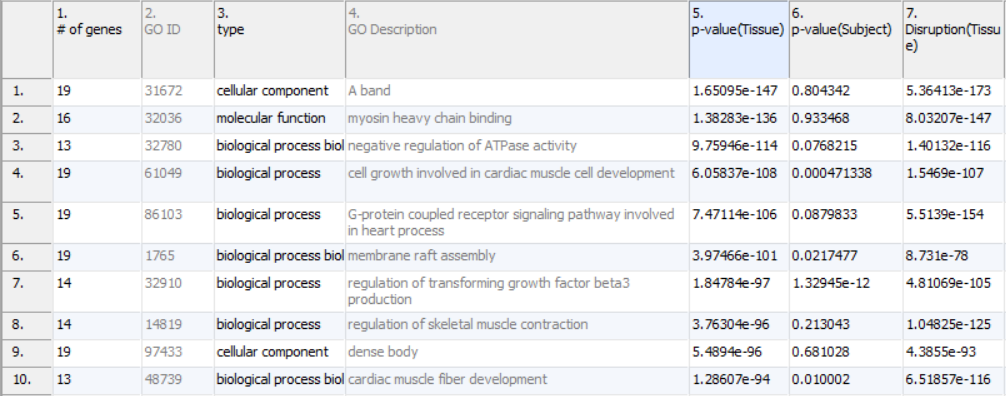
If the disruption (factor*gene interaction) is tested, the filters can become more complicated. The most pressing need for complex filters is that when analyzing larger functional groups it is not expected that the entire functional group will behave the same. Looking back at Figure 1, notice how the low values in column 6 7 are present because not every gene is equally differentially expressed even in the most differentially expressed of groups. That is, when there is significant differential expression, it is likely that there will also be disruption as at least a single gene is likely participating in a role beyond that of the functional group and will not follow the pattern of the rest of the group. This situation is expected and leads to a new type of filter.
Filtering for low p-values on the factor and then filtering for low p-values on the factor interacted with gene will find groups that are differentially expressed, but contain at least a few genes that are either disrupted due to treatment, or simply are involved in additional functional groups beyond the scope of the one being analyzed. This list often contains some of the more informative big picture functional groups.
| Numbered figure captions | ||||
|---|---|---|---|---|
| ||||
|
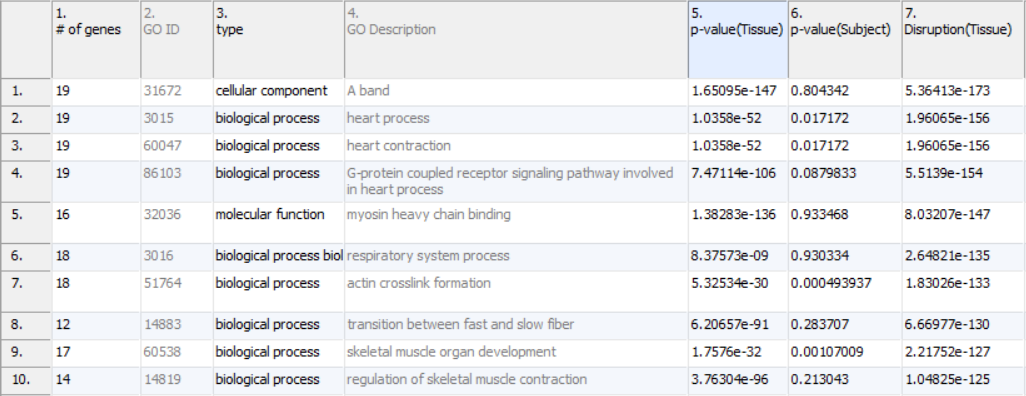
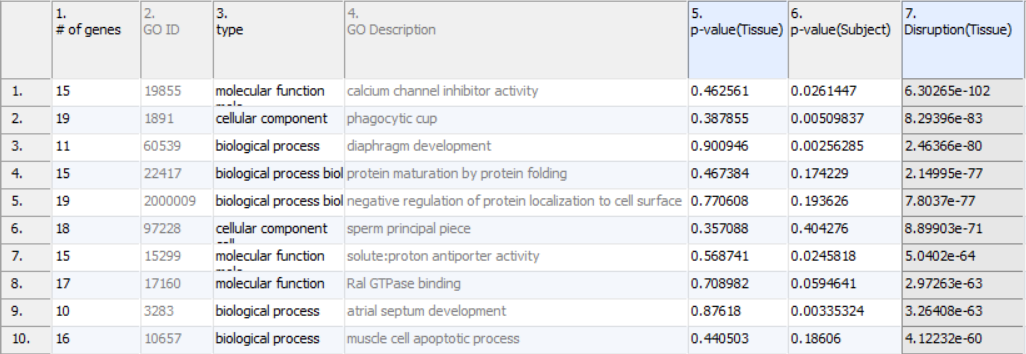
If looking for disruption for groups which are not so much differentially expressed, but instead which express different genes for different treatments, filter for low disruption p-values but for high factor p-values. As shown by Figure 2, large or diverse groups that are differentially expressed will often exhibit significant disruption. In fact, a group that is differentially expressed but includes even a single gene that is not changed will have very significant disruption. These situations are certainly notable, but are distracting if looking for functional groups that instead are uniquely patterned based on treatment. By filtering out those groups with low p-values for the factor and then looking at the remaining groups with low p-values for disruption, groups observed have usually very distinct patterns of expression (Figure 3).
| Numbered figure captions | ||||
|---|---|---|---|---|
| ||||
|
| Additional assistance |
|---|
|
| Rate Macro | ||
|---|---|---|
|
Overview
Content Tools