Page History
| Table of Contents | ||||
|---|---|---|---|---|
|
What is Kraken?
Kraken is a taxanomic sequence classifier that assigns taxonomic labels to short DNA sequences, typically from microbiome or metagenomic studies [(1]). Kraken classifies reads to a best-match location in a taxonomic tree (the lowest common ancestor), so not all sequences will be classified to a particular level such as species. Kraken matches k-mers (nucleotide sequences of k bases in length) within a read to a database database of k-mer sequences from known genomes with established taxonomic relationships to perform its classifications. Partek Flow currently wraps Kraken version 2.0.8-beta (2), but Kraken 0.10.5-beta is also available (to roll back to the older version, see Task Management).
Running Kraken
Kraken tasks takes FASTQ files as input. Reads can be single- or paired-end.
- Click a data node with FASTQ files
- Click the Metagenomics section of the toolbox
- Click Kraken
- Choose a Kraken database
- Configure parameters
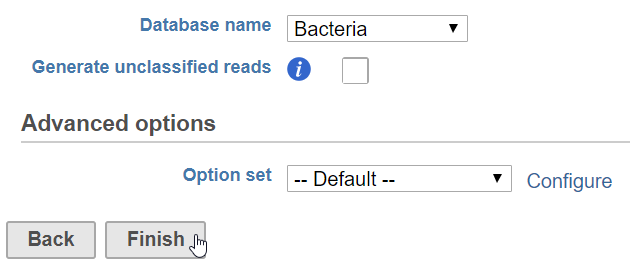
- Click Finish to run (Figure 1)
...
| Numbered figure captions | ||||
|---|---|---|---|---|
| ||||
|
Kraken generates a Classified sequence data nodea Taxonomic data node. This data type is the can be used as input for the the Alpha & beta diversity task.Beta diversity and Choose taxonomic level tasks. If you want to obtain the Kraken output files, select the new data node and choose Download data from the toolbox on the right.
Kraken parameters
Database name
...
| Numbered figure captions | ||||
|---|---|---|---|---|
| ||||
|
Table
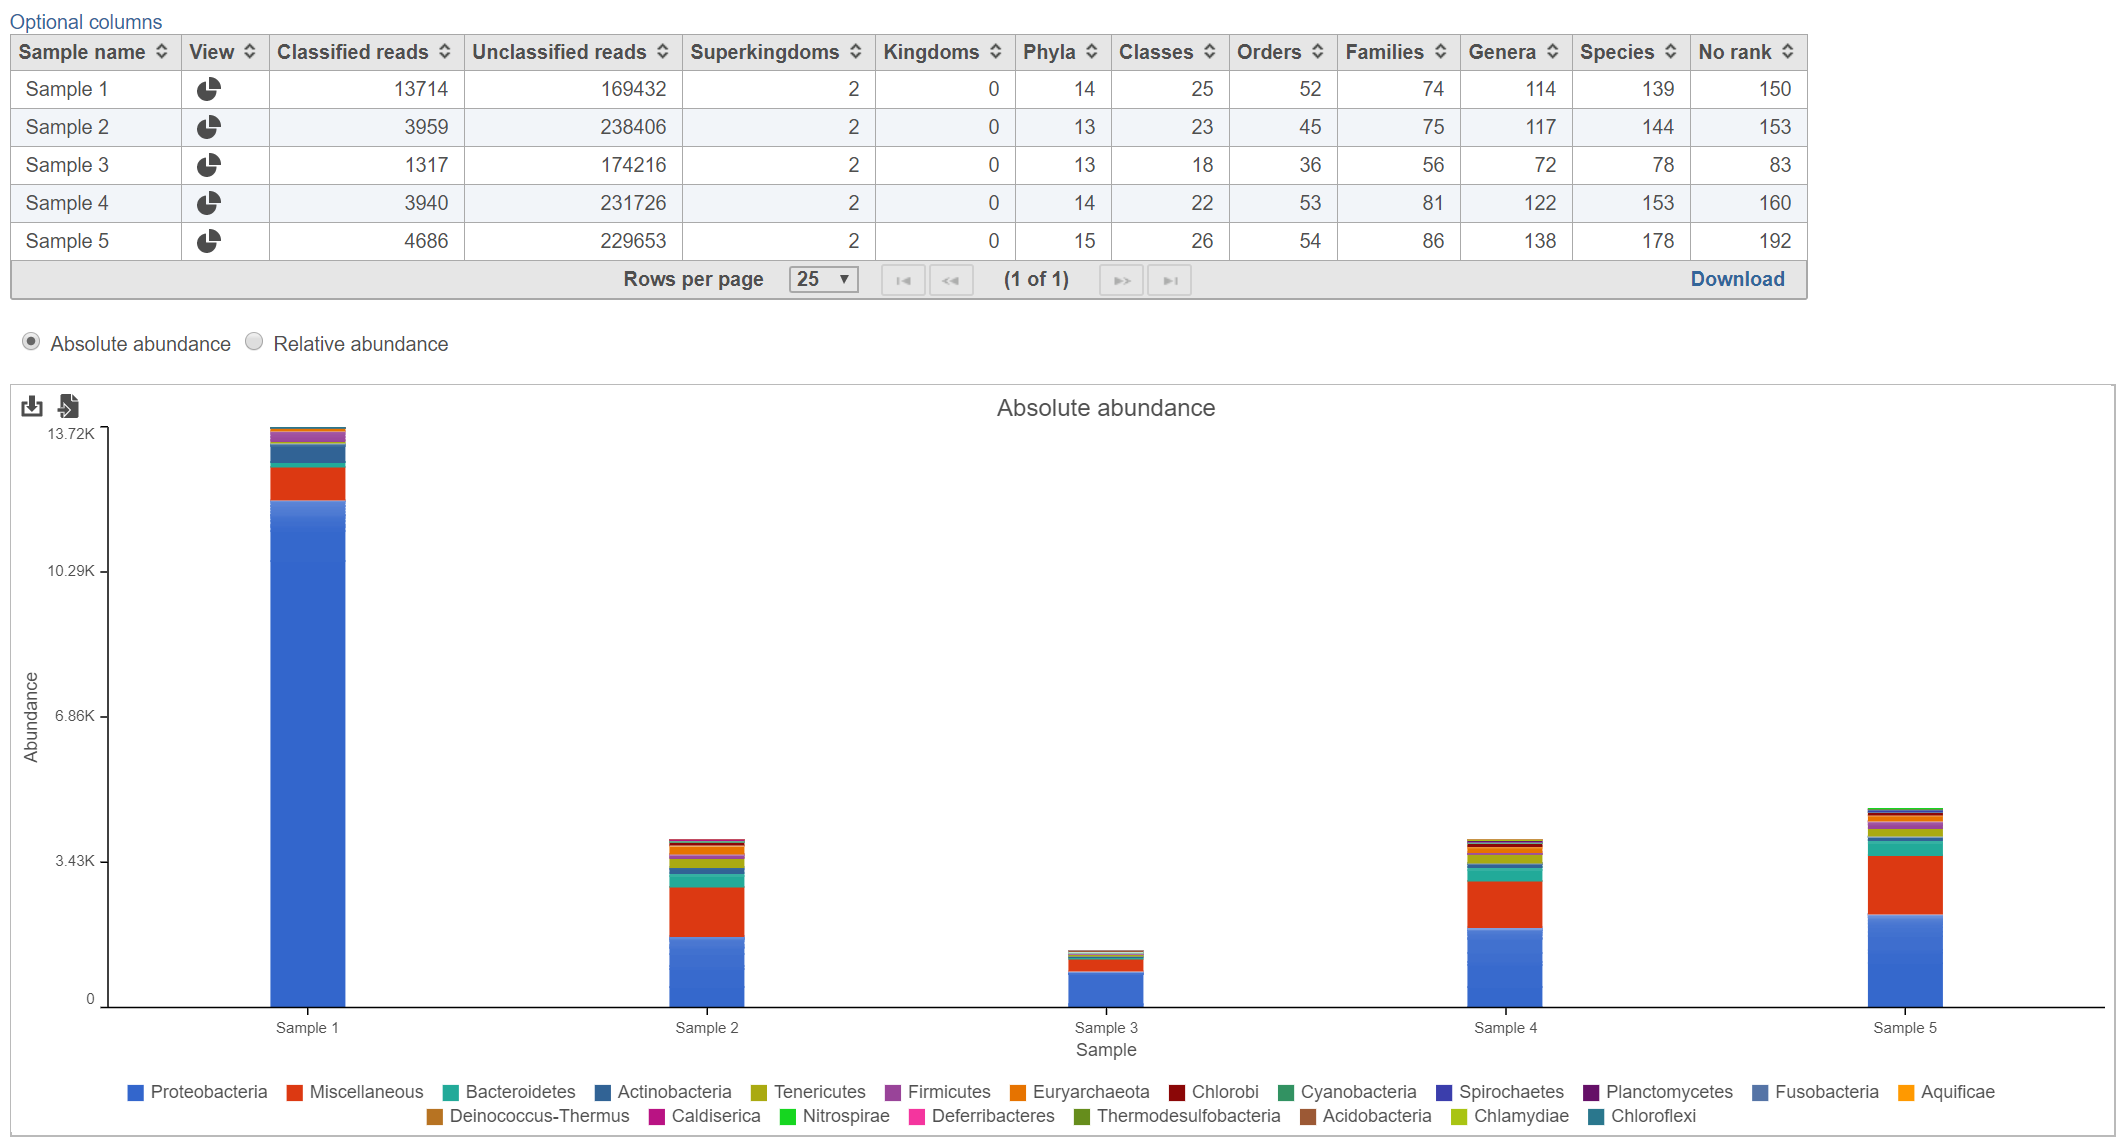
The table lists each sample and gives the following values:
...
Lists the number of different values are represented for taxa that were detected within each taxonomic level among the classified reads for each sample. For example, in Figure 2, there were 139 different species detected in Sample 1.
Bar chart
The stacked bar chart shows the abundance or relative abundance of the different phyla. The legend lists the color of each phyla. Mouse over a bar to view the breakdown of classes families within the phyla (Figure 3). Use the radio button to switch between Absolute abundance and Relative abundance.
...
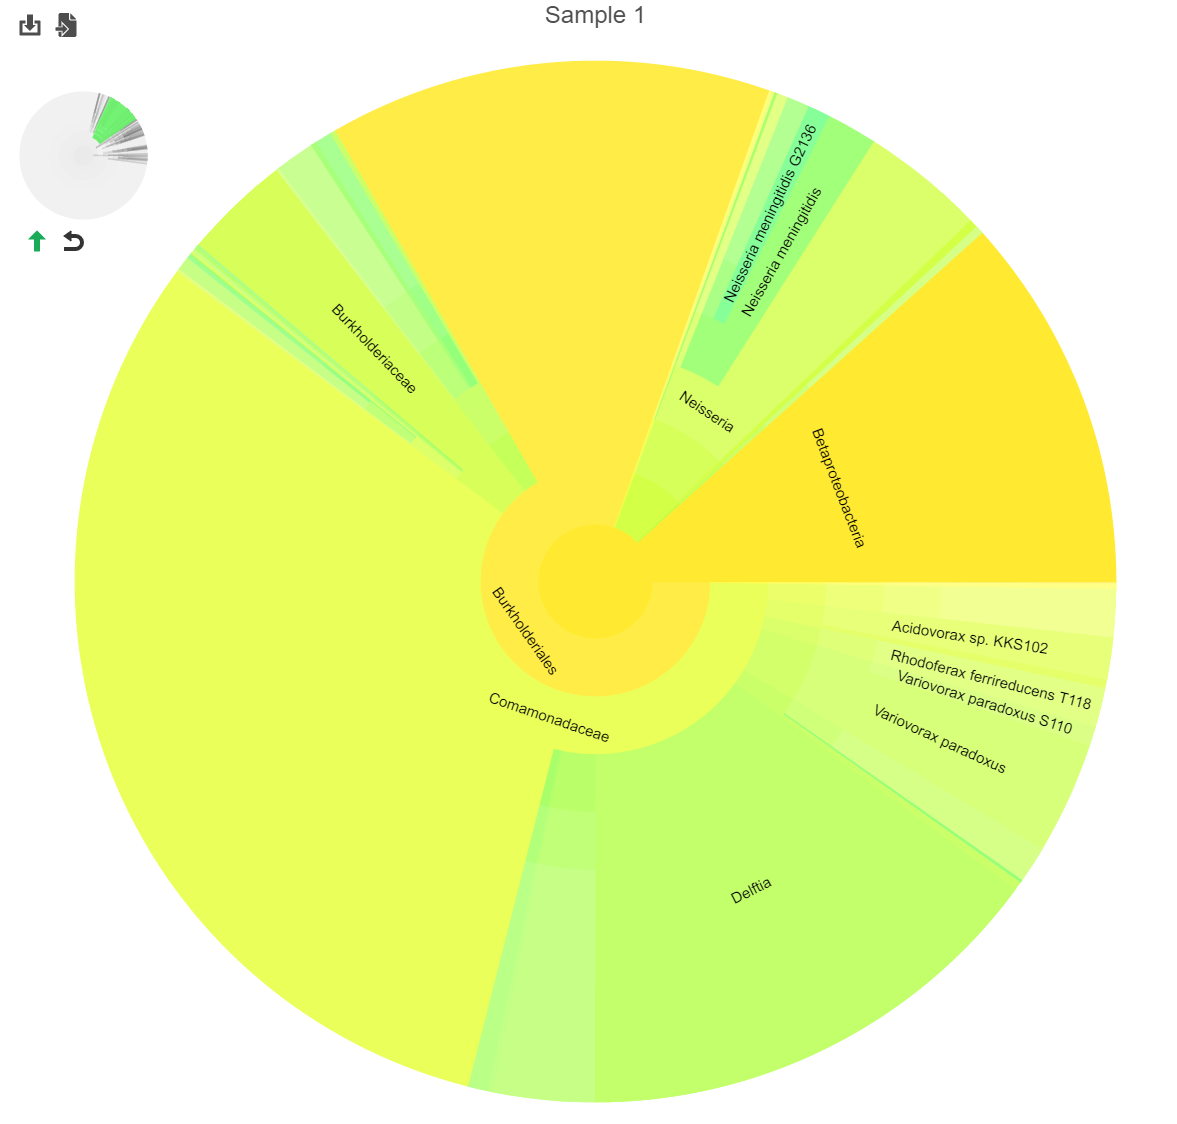
Clicking a section of the pie chart zooms in to that section by setting the selected level as the root (Figure 25).
| Numbered figure captions | ||||
|---|---|---|---|---|
| ||||
|
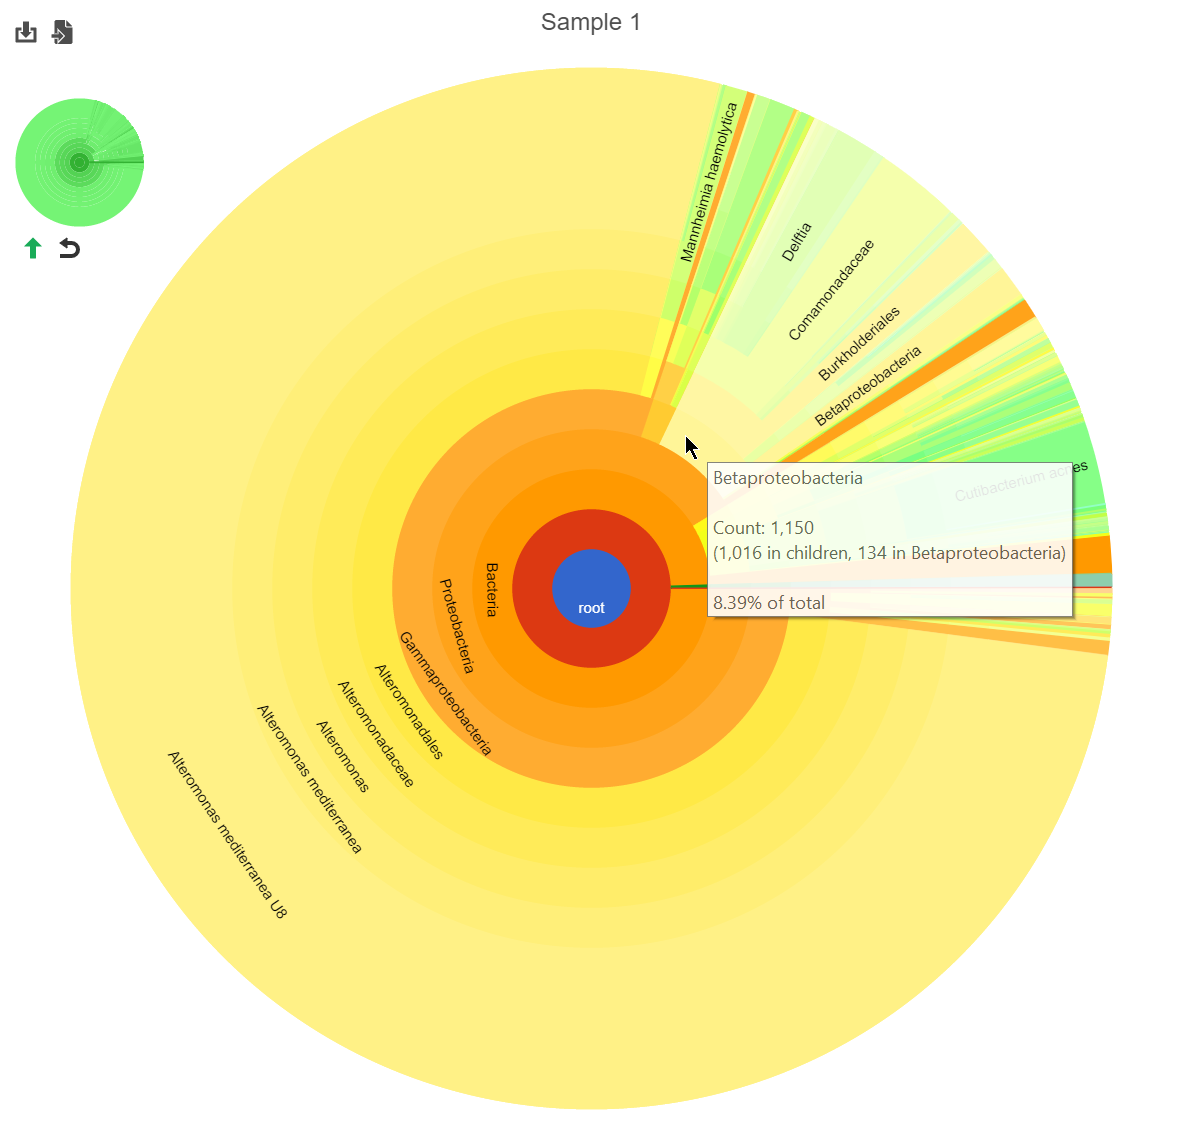
Click the green arrow![]() to move up one taxanomic taxonomic level (set the root to one level higher). Click reset
to move up one taxanomic taxonomic level (set the root to one level higher). Click reset ![]() to show the entire pie chart.
to show the entire pie chart.
The mini-map on the upper left is shaded in green to indicate which section of the original pie chart is currently shown (Figure 25).
References
[1] Wood . Wood DE, Salzberg SL: Kraken: ultrafast metagenomic sequence classification using exact alignments. Genome Biology 2014, 15:R46.
2. Wood DE, Lu J & Langmead B: Improved metagenomic analysis with Kraken 2. Genome Biol 2019, 20:257
| Additional assistance |
|---|
| Rate Macro | ||
|---|---|---|
|
...
Overview
Content Tools