Page History
...
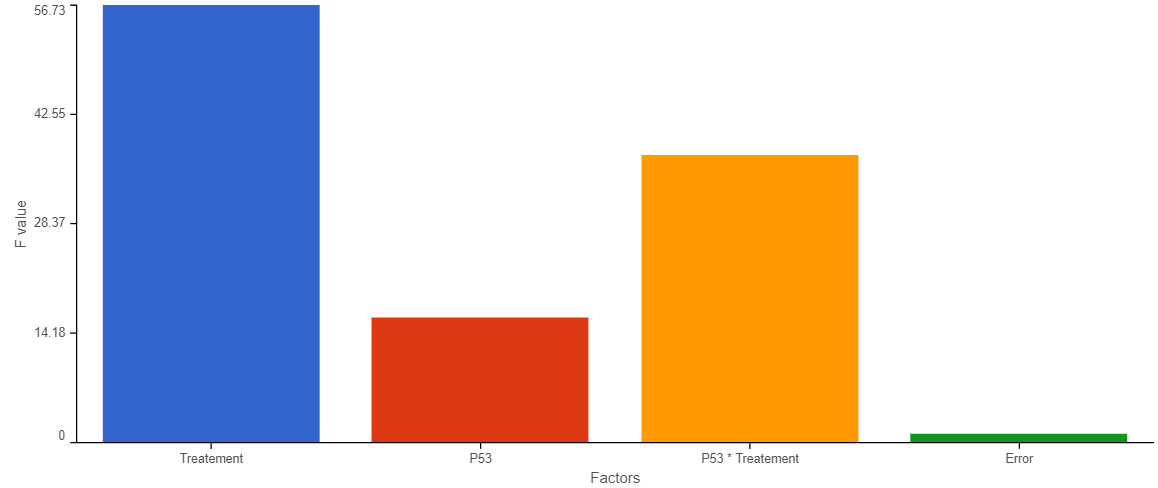
A large F value for a factor indicates that between group variation is greater than within group variation, which results in a small p-value for that factor. Conversely, a small F value for a factor indicates the between group variation is smaller than within group variation, which results in a big p-value for that factor.
In Partek ® Flow®, the Sources of variation plot uses a bar chart to show the F value for each factor in the ANOVA model relative to the error. The plot is available for each gene in an ANOVA result. To open the Sources of variation plot for a gene in the ANOVA results table, click on the icon  next to the gene symbol to invoke the plot. It is useful to examine the plot to understand the contribution of all the factors in the ANOVA model to the overall variance in the data set relative to their within group variation (Figure 1).
| Numbered figure captions | ||||
|---|---|---|---|---|
| ||||
|
...
Plot controls are in the panel on the left. The <Previous and Next> buttons enable you to switch between features as they appear in the ANOVA results table. The bar chart colors are controlled by the Customize colors option. If you want to customize the colors, click the  icon to configure the color palette.
| Additional assistance |
|---|
| Rate Macro | ||
|---|---|---|
|
Overview
Content Tools