Page History
...
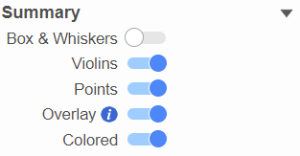
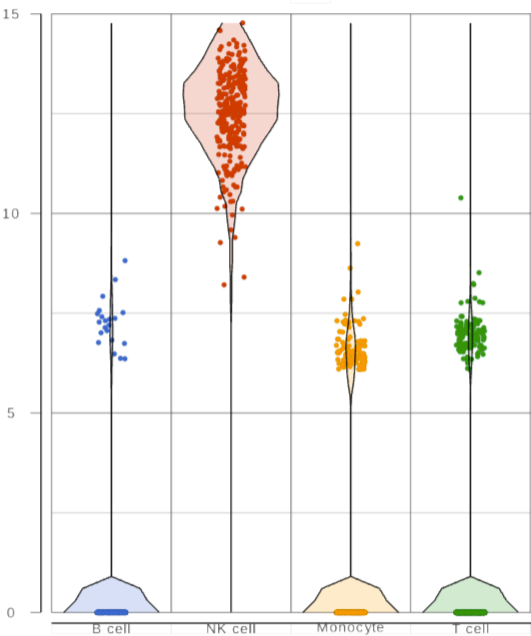
When you have a lot of observations to display, you can choose to plot add box-whiskers and/or violin plot on the graph (Figure 3), by turn turning on/off the options to display the different type of plots in Style card from the configuration panel.
| Numbered figure captions | ||||
|---|---|---|---|---|
| ||||
|
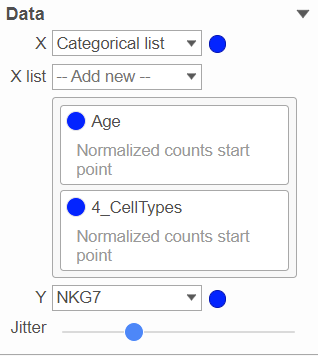
You can have multiple categorical attributes on an axis, e.g. X-axis represent both cell type and age group (Figure 4). Click on the attribute to drag to change the order of the attributes
| Numbered figure captions | ||||
|---|---|---|---|---|
| ||||
|
ghjkl
Click the Export image button to save a PNG, SVG, or PDF image to your computer.
Click the To notebook button to send the image to a page in the Notebook.
ghjkl
ghjkl
ghjkl
| Additional assistance |
|---|
| Rate Macro | ||
|---|---|---|
|
...
Overview
Content Tools