Page History
...
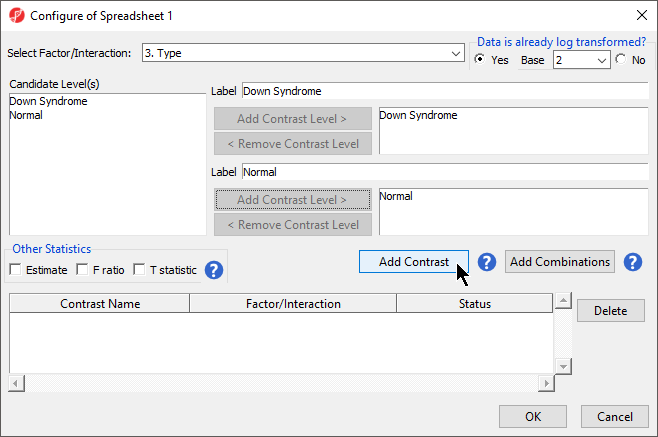
- Select Contrasts… to invoke the Configure dialog
- Choose 6Choose 3.Type from the Select Factor/Interaction drop-down list. The levels in this factor are listed on the Candidate Level(s) panel on the left side of the dialog
- Left click to select Down Syndrome from the Candidate Level(s) panel and move it to the Group 1 panel (renamed Down Syndrome) by selecting Add Contrast Level > in the top half of the dialog.
...
| Numbered figure captions | ||||
|---|---|---|---|---|
| ||||
|
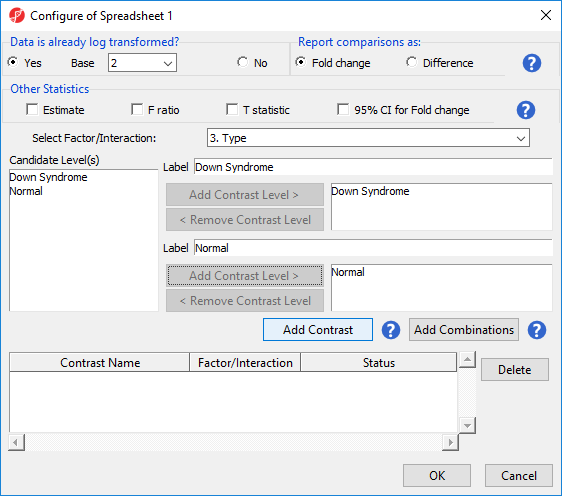
Because the data is log2 transformed, Partek Genomics Suite will automatically detect this and will automatically select Yes for Data is already log transformed? in the top right-hand corner of the dialog. Partek Genomics Suite will use the geometric mean of the samples in each group to calculate the fold change and mean ratio for the contrast between the Down syndrome and normal samples.
...
Deciding which factors to include in the ANOVA may be an iterative process while you decide which factors and interactions are relevant as not all factors have to be included in the model. For example, in this tutorial, Gender and Scan date were not included. The Sources of Variation plot is a way to quantify the relative contribution of each factor in the model towards explaining the variability of the data.
- Select Plot View Sources of Variation from the Analysis section of the Gene Expression workflow with the ANOVA result spreadsheet active
...
Overview
Content Tools