Page History
...
By default, all samples are used to perform QA/QC. If there is more than one sample, you You can choose to split the sample and perform QA/QC separately for each sample.
...
| Numbered figure captions | ||||
|---|---|---|---|---|
| ||||
|
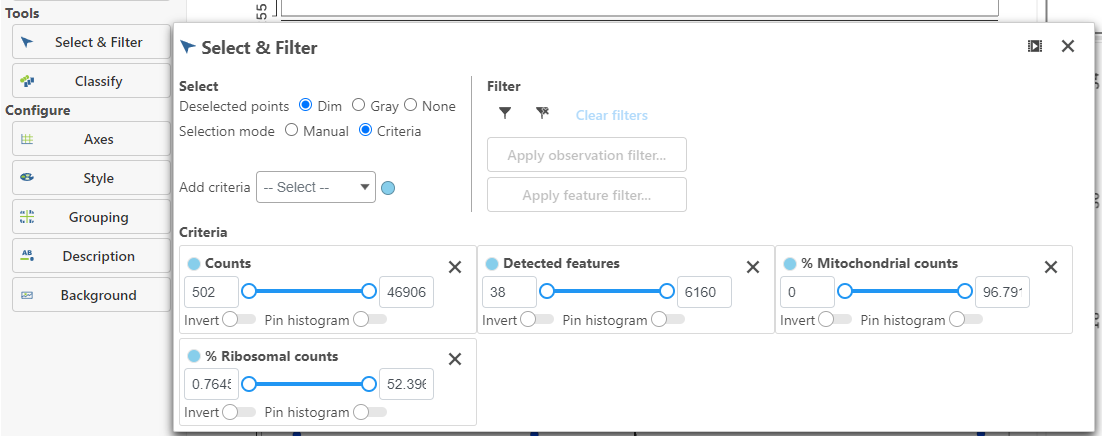
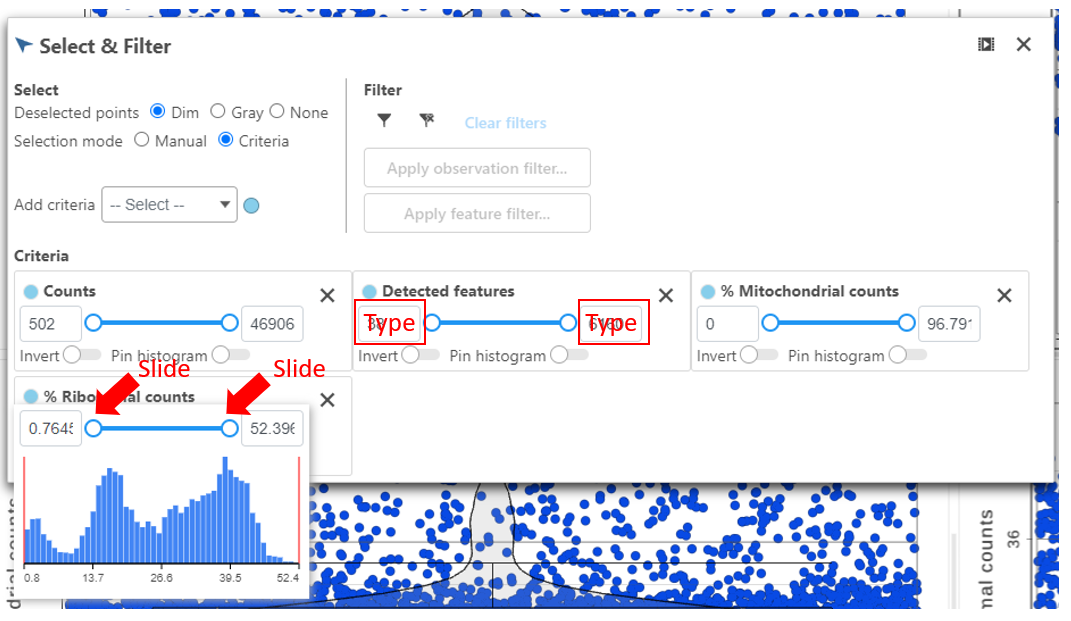
Hovering the mouse over one of the selection criteria reveals a histogram showing you the frequency distribution of the respective quality metric. The minimum and maximum thresholds can be adjusted by clicking and dragging the sliders or by typing directly into the text boxes for each selection criteria (Figure 6).
...
| Numbered figure captions | ||||
|---|---|---|---|---|
| ||||
|
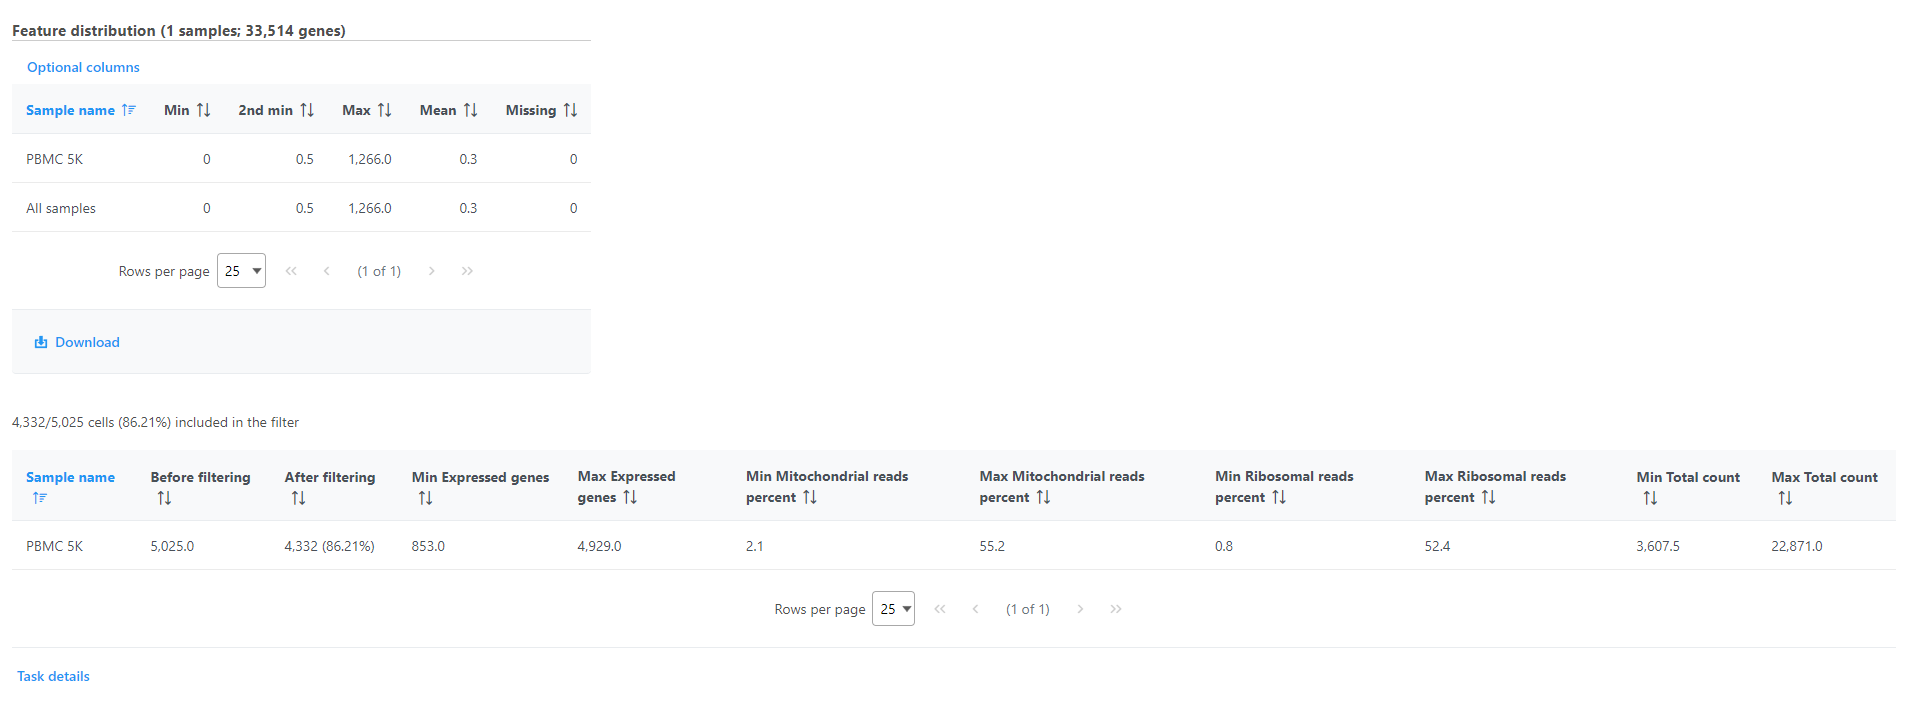
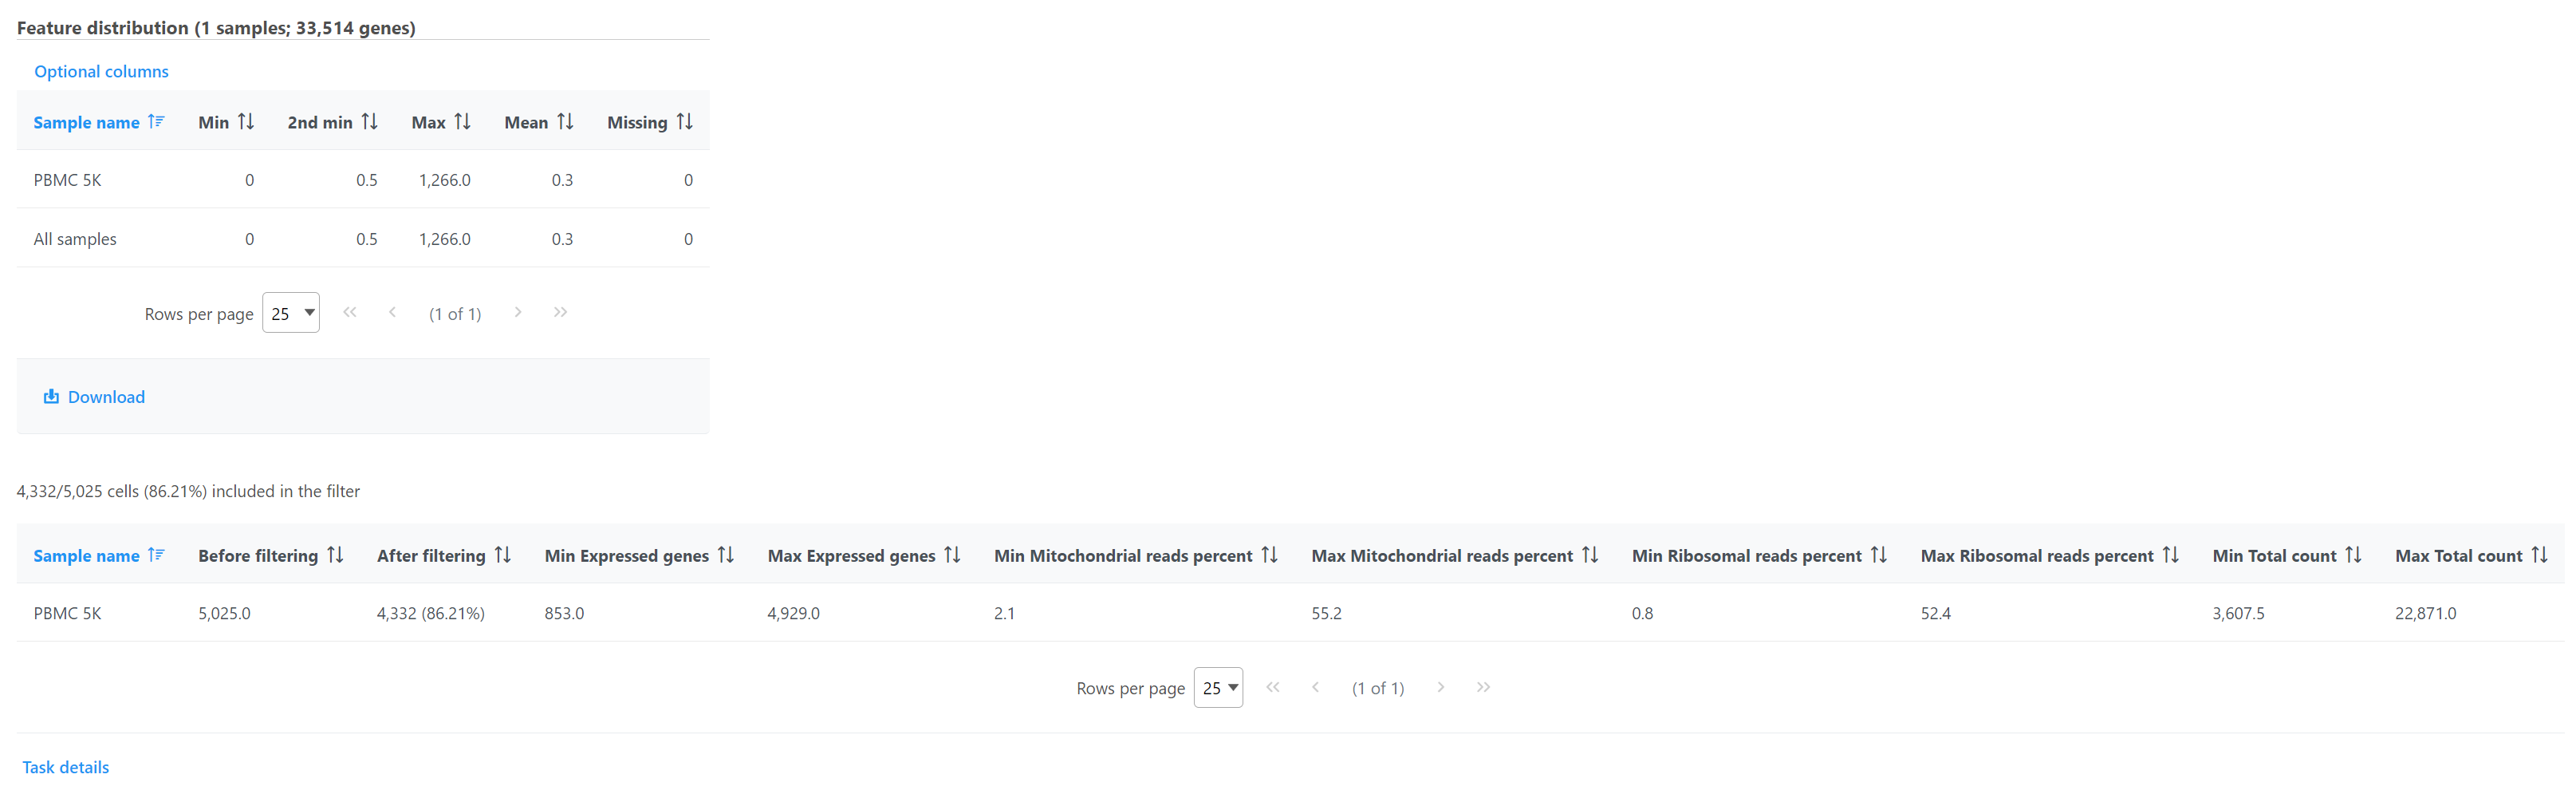
Alternatively, Pin histogram to view all of the distributions at one time to determine thresholds with ease (Figure 7).
...
| Numbered figure captions | ||||
|---|---|---|---|---|
| ||||
|
| Additional assistance |
|---|
...
Overview
Content Tools