Page History
...
| Numbered figure captions | ||||
|---|---|---|---|---|
| ||||
|
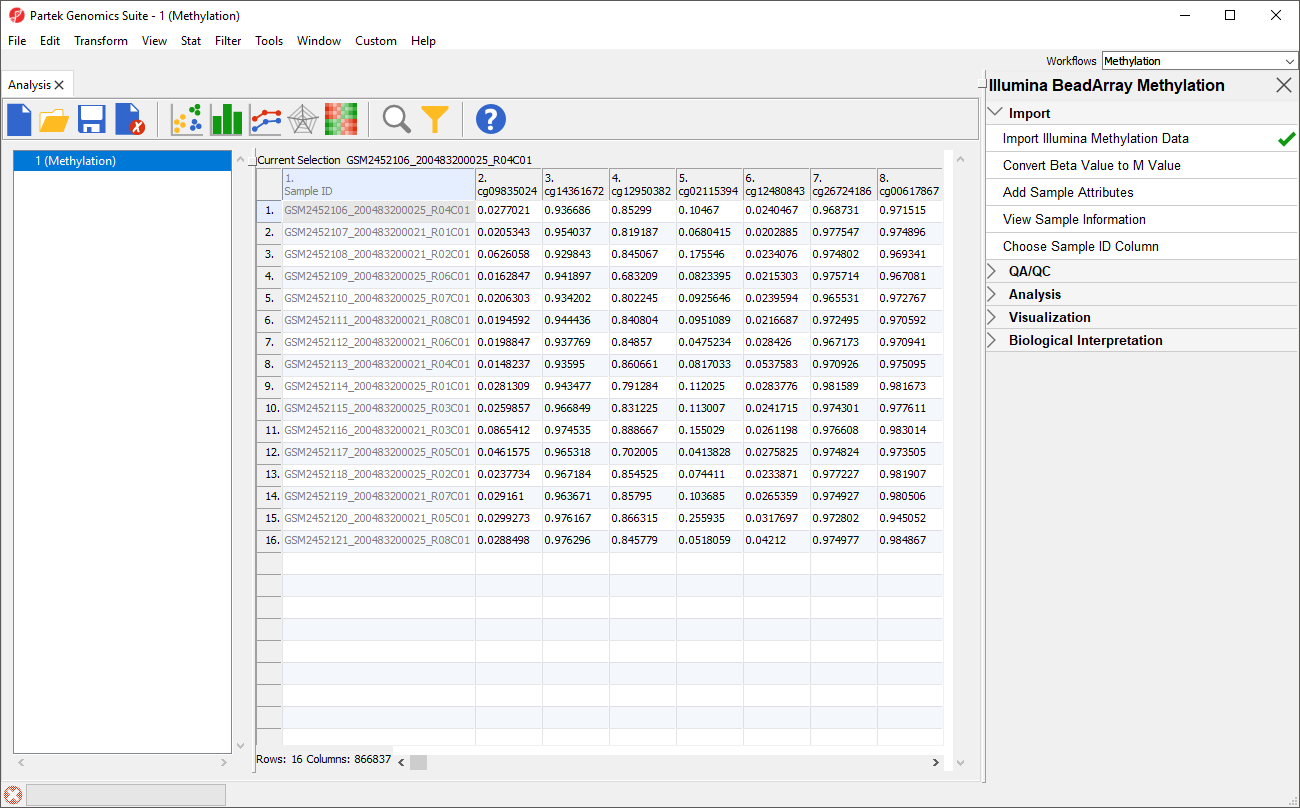
An alternative metric for measurement of methlyation levels are M-values. β-values can be easily converted to M-values using the following equation:
M-value = log2( β / (1 - β))
An M-value close to 0 for a CpG site indicates a similar intensity between the methylated and unmethylated probes, which means the CpG site is about half-methylated. Positive M-values mean that more molecules are methylated than unmethylated, while negative M-values mean that more molecules are unmethylated than methylated. As discussed by Du and colleagues, the β-value has a more intuitive biological interpretation, but the M-value is more statistically valid for the differential analysis of methylation levels.
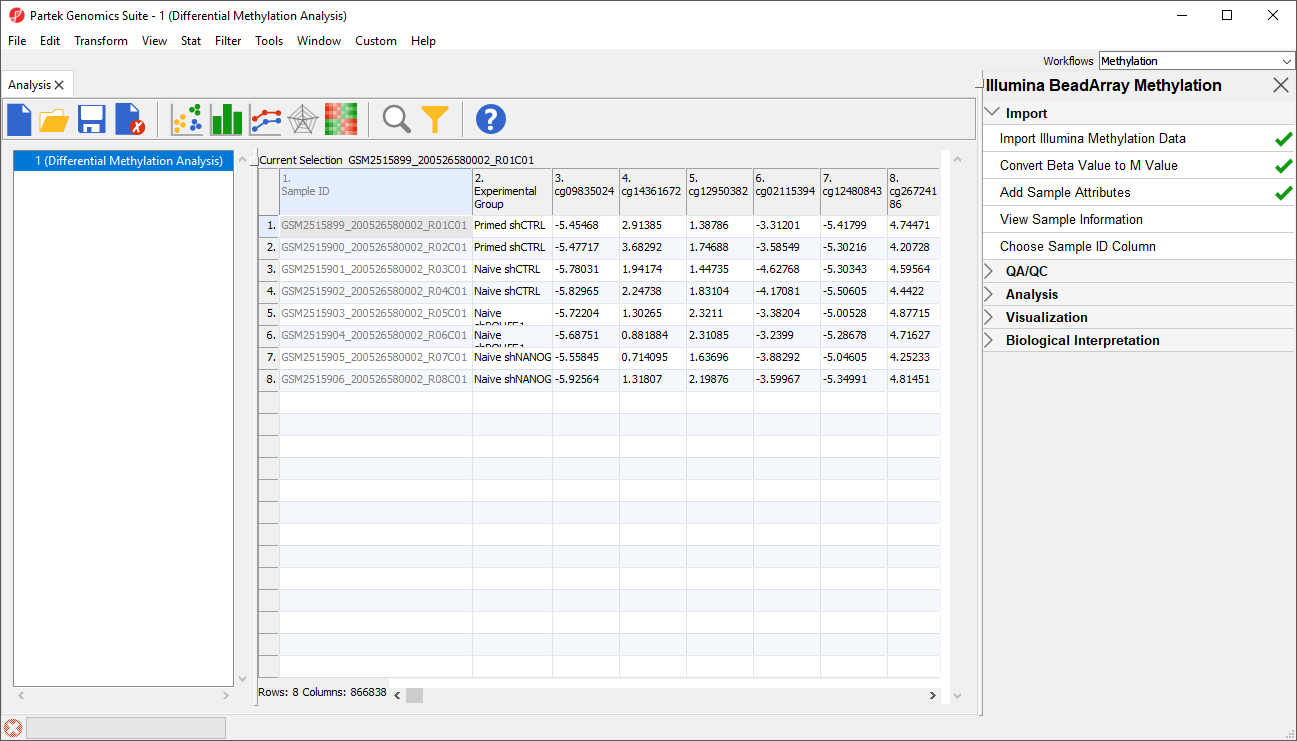
Because we are performing differential methylation analysis, we need to convert our data to from β-values to M-values.
- Select Convert Beta Value to M Value from the Import section of the Illumina BeadArray Methylation workflow
The original data (β-values) will be overwritten.
- Select (
 ) from the icon bar to save the current spreadsheet
|
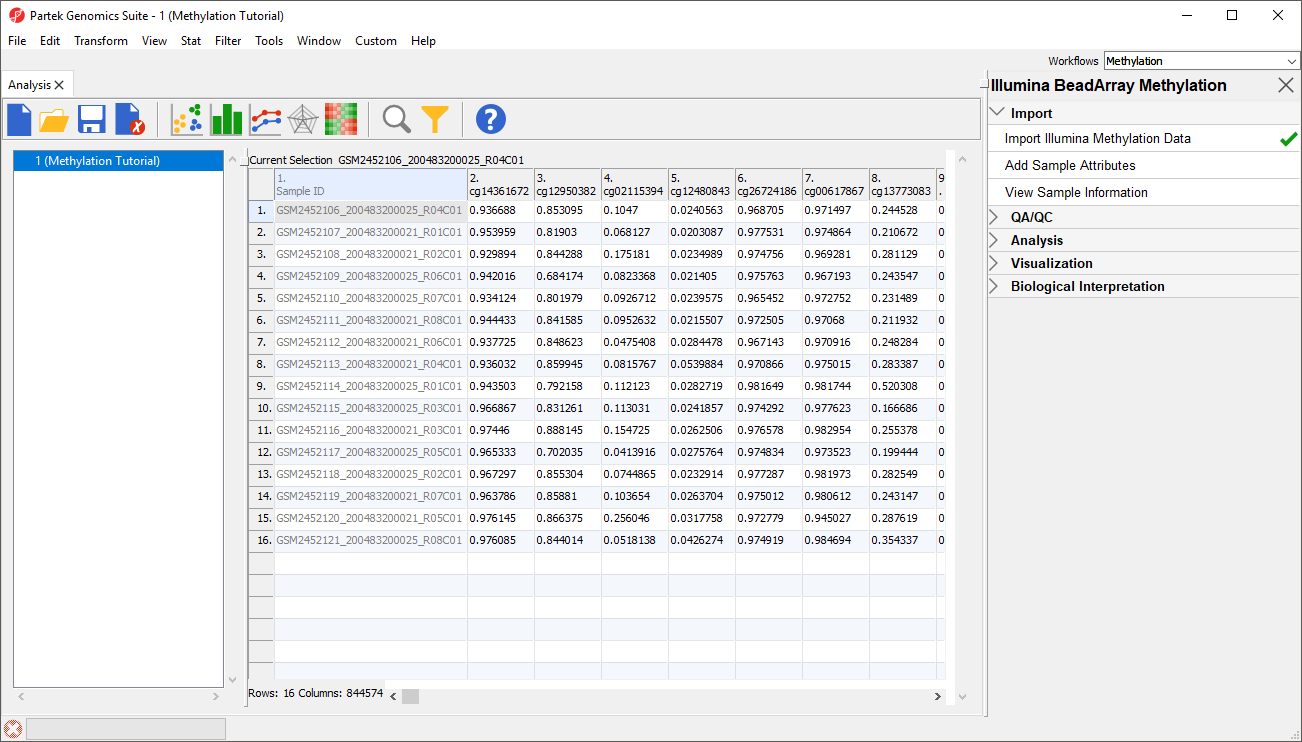
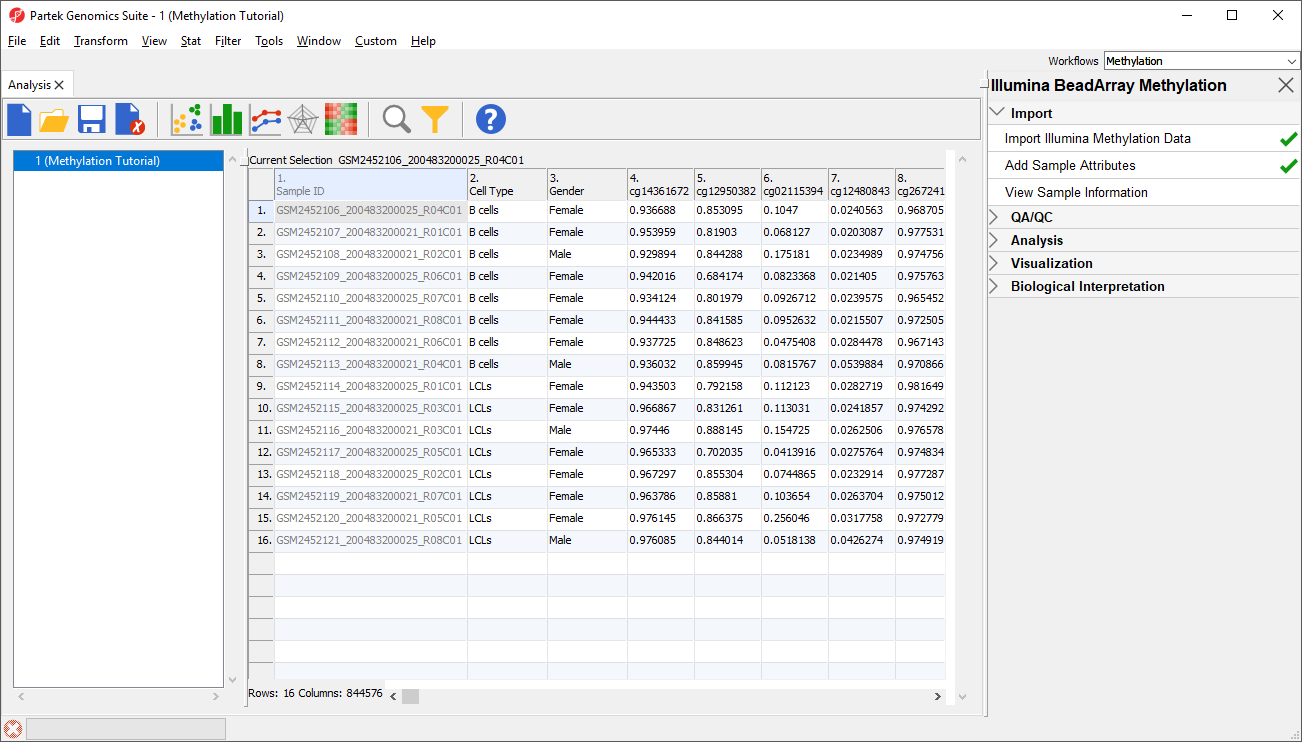
Before we can perform any analysis, the study samples need to be organized into their experimental groups.
...
Two new columns have been added to spreadsheet 1 (Methylation) with the cell type and gender of each sample .
For this tutorial, we want to exclude all male samples to simplify our analysis. To do this, we can use the interactive filter.
- Select (
 ) from the quick action bar to invoke the interactive filter
 - Select 4. CHR for Column
For categorical columns, the interactive filter displays each category of the selected column as a colored bar. For 4. CHR, each bar represents a chromosome with the height of bar representing the number of probes from that chromosome in the selected spreadsheet. To filter out a category, left-click on its bar. Right clicking on a bar will include only the selected category. A pop up balloon will show the category label as you mouse over each bar.
...
(Figure 5).
The yellow and black bar on the right-hand side of the spreadsheet panel shows the fraction of excluded cells in black and included cells in yellow. Right-clicking this bar brings up an option to clear the filter.
Now that we have filtered out probes on the X and Y chromosomes, we will create a spreadsheet containing only probes on the autosomes.
- Right click on the ANOVA-1way (ANOVAResults) spreadsheet in the spreadsheet tree panel (Figure 4)
| Numbered figure captions | |
|---|---|
|
...
| |||
|
| Page Turner | ||
|---|---|---|
|
...
Overview
Content Tools