Page History
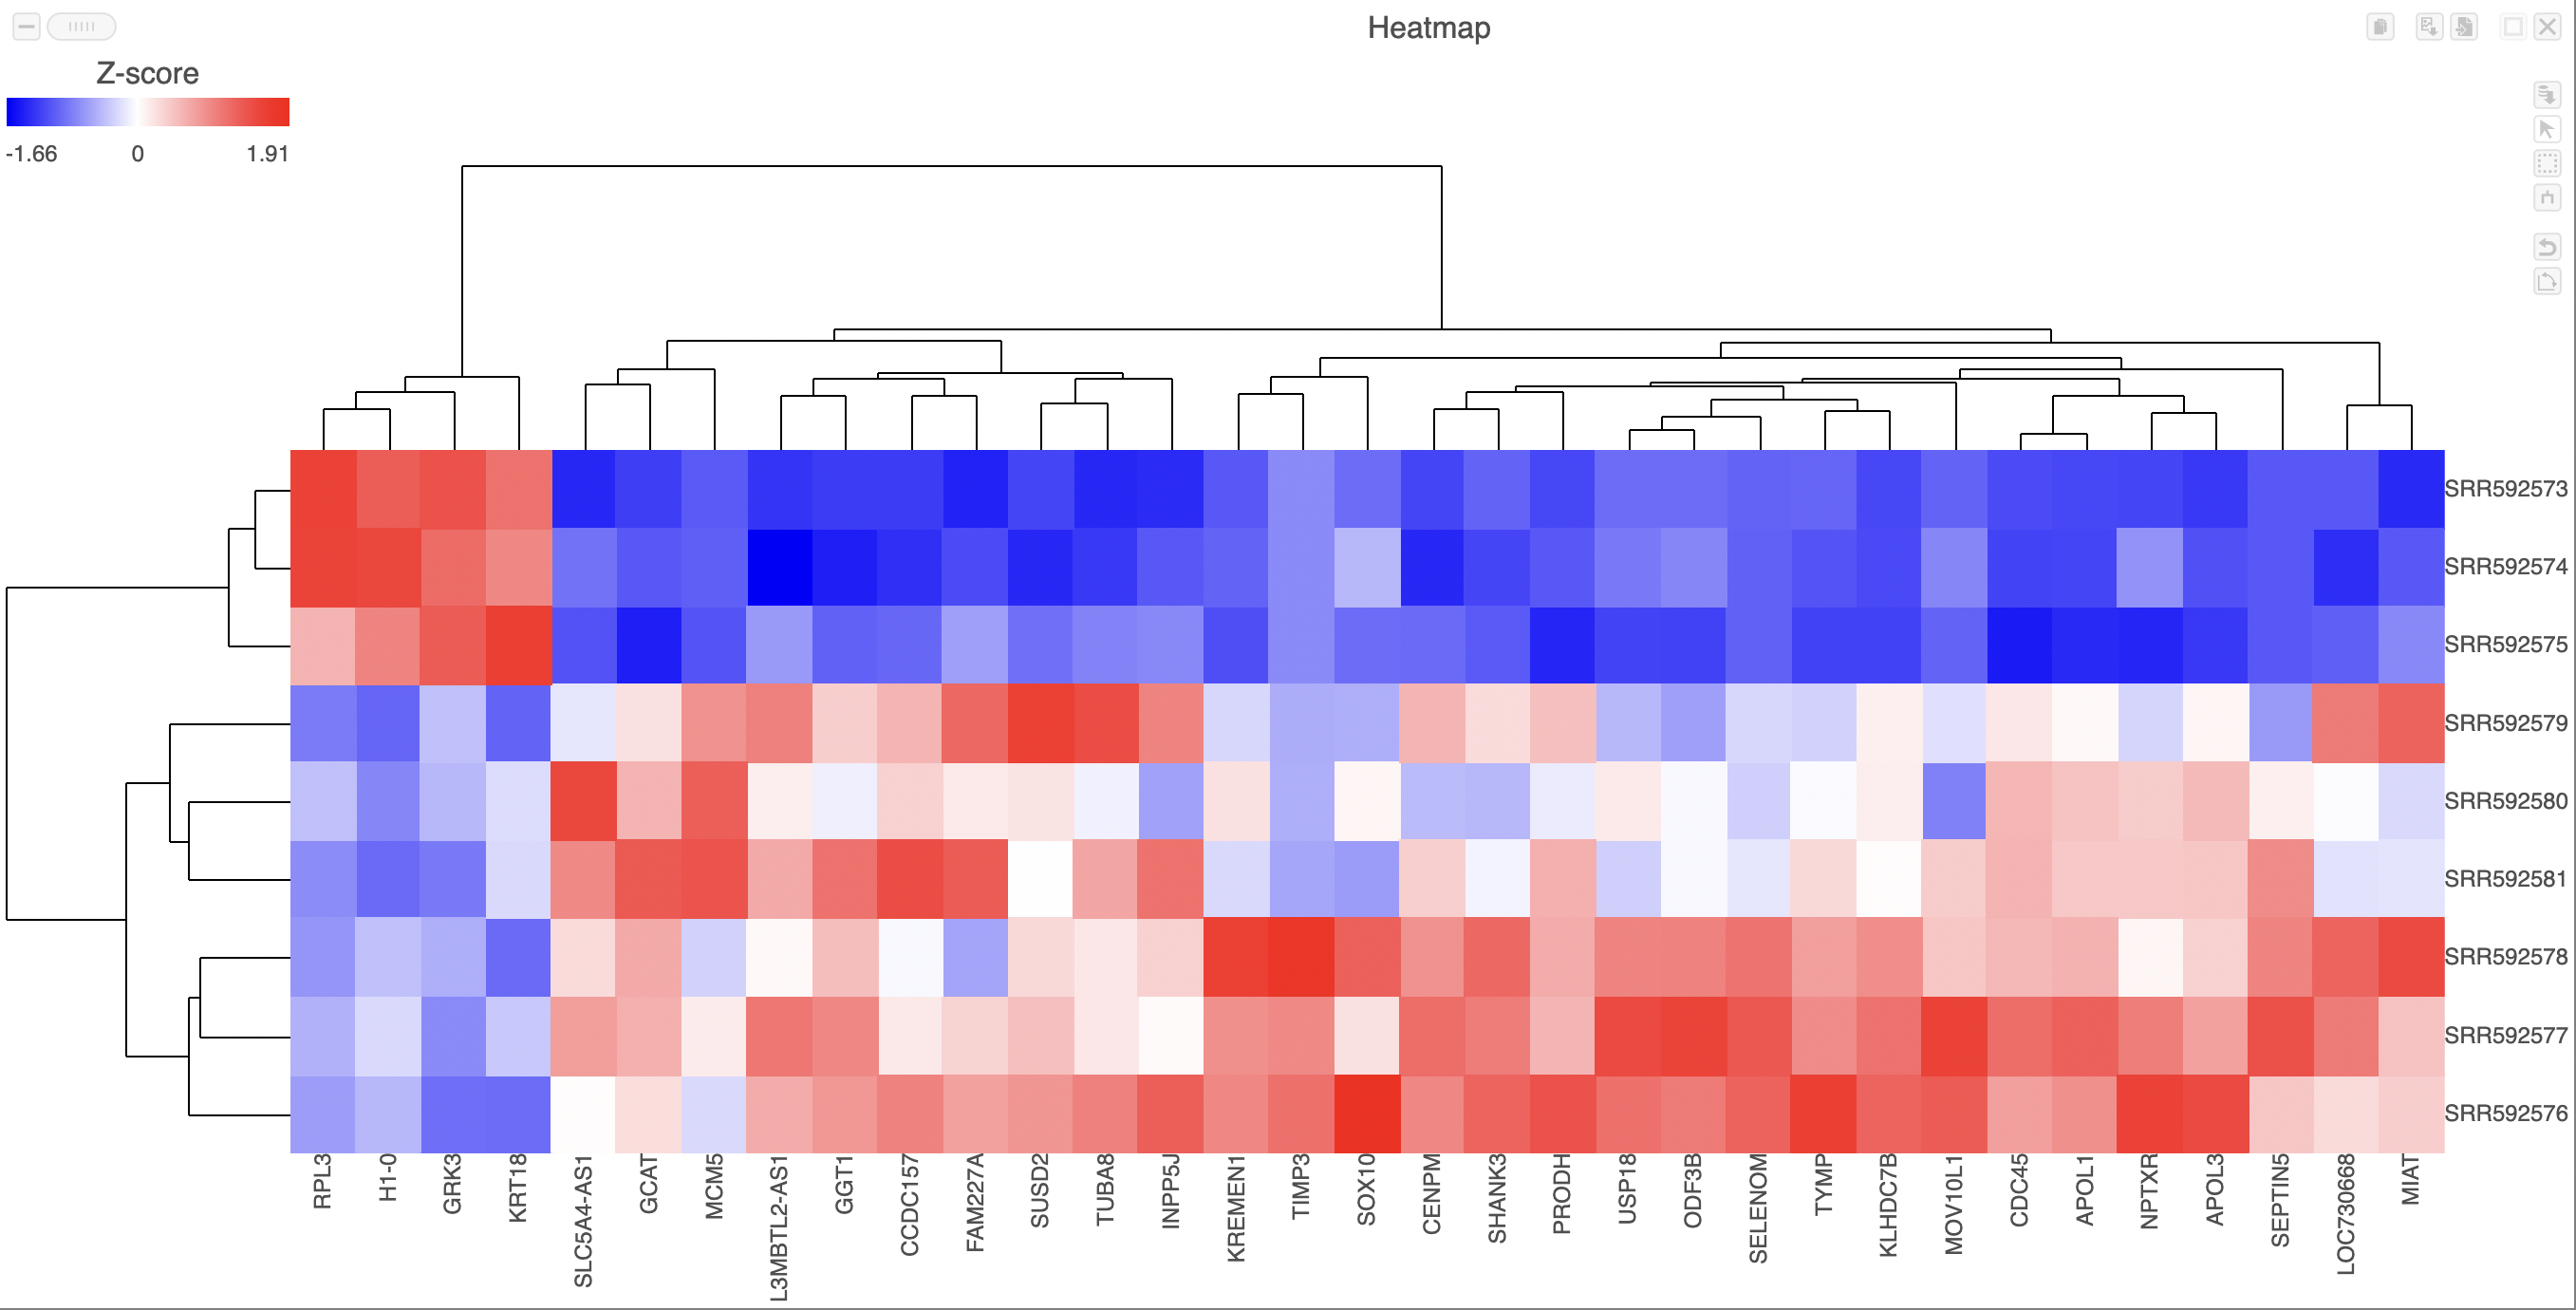
Heatmaps can be used to explore gene expression trends across samples. They are a useful tool in visualising the results of the hierarchical clustering of a gene list. It They can be employed to visually distinguish between different samples and different treatments across a dataset. After having performed a hierarchical clustering task, double-clicking the Hierarchical clustering / heatmap task node will automatically launch the heatmap in a new data viewer session (Figure 1).
...
| Numbered figure captions | ||||
|---|---|---|---|---|
| ||||
|
...
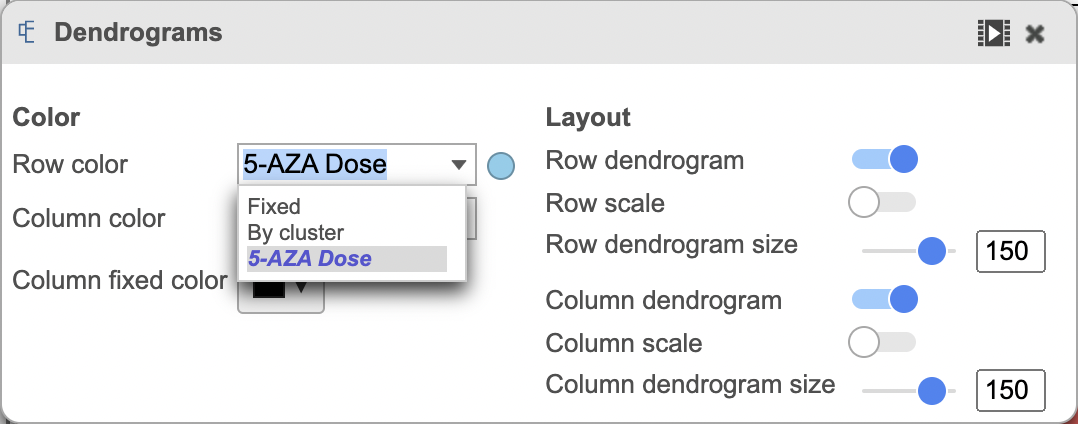
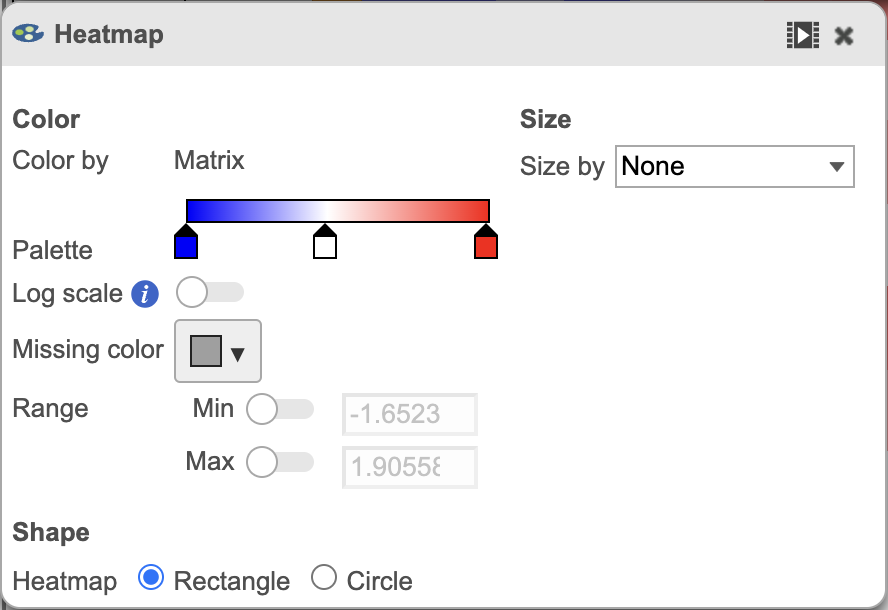
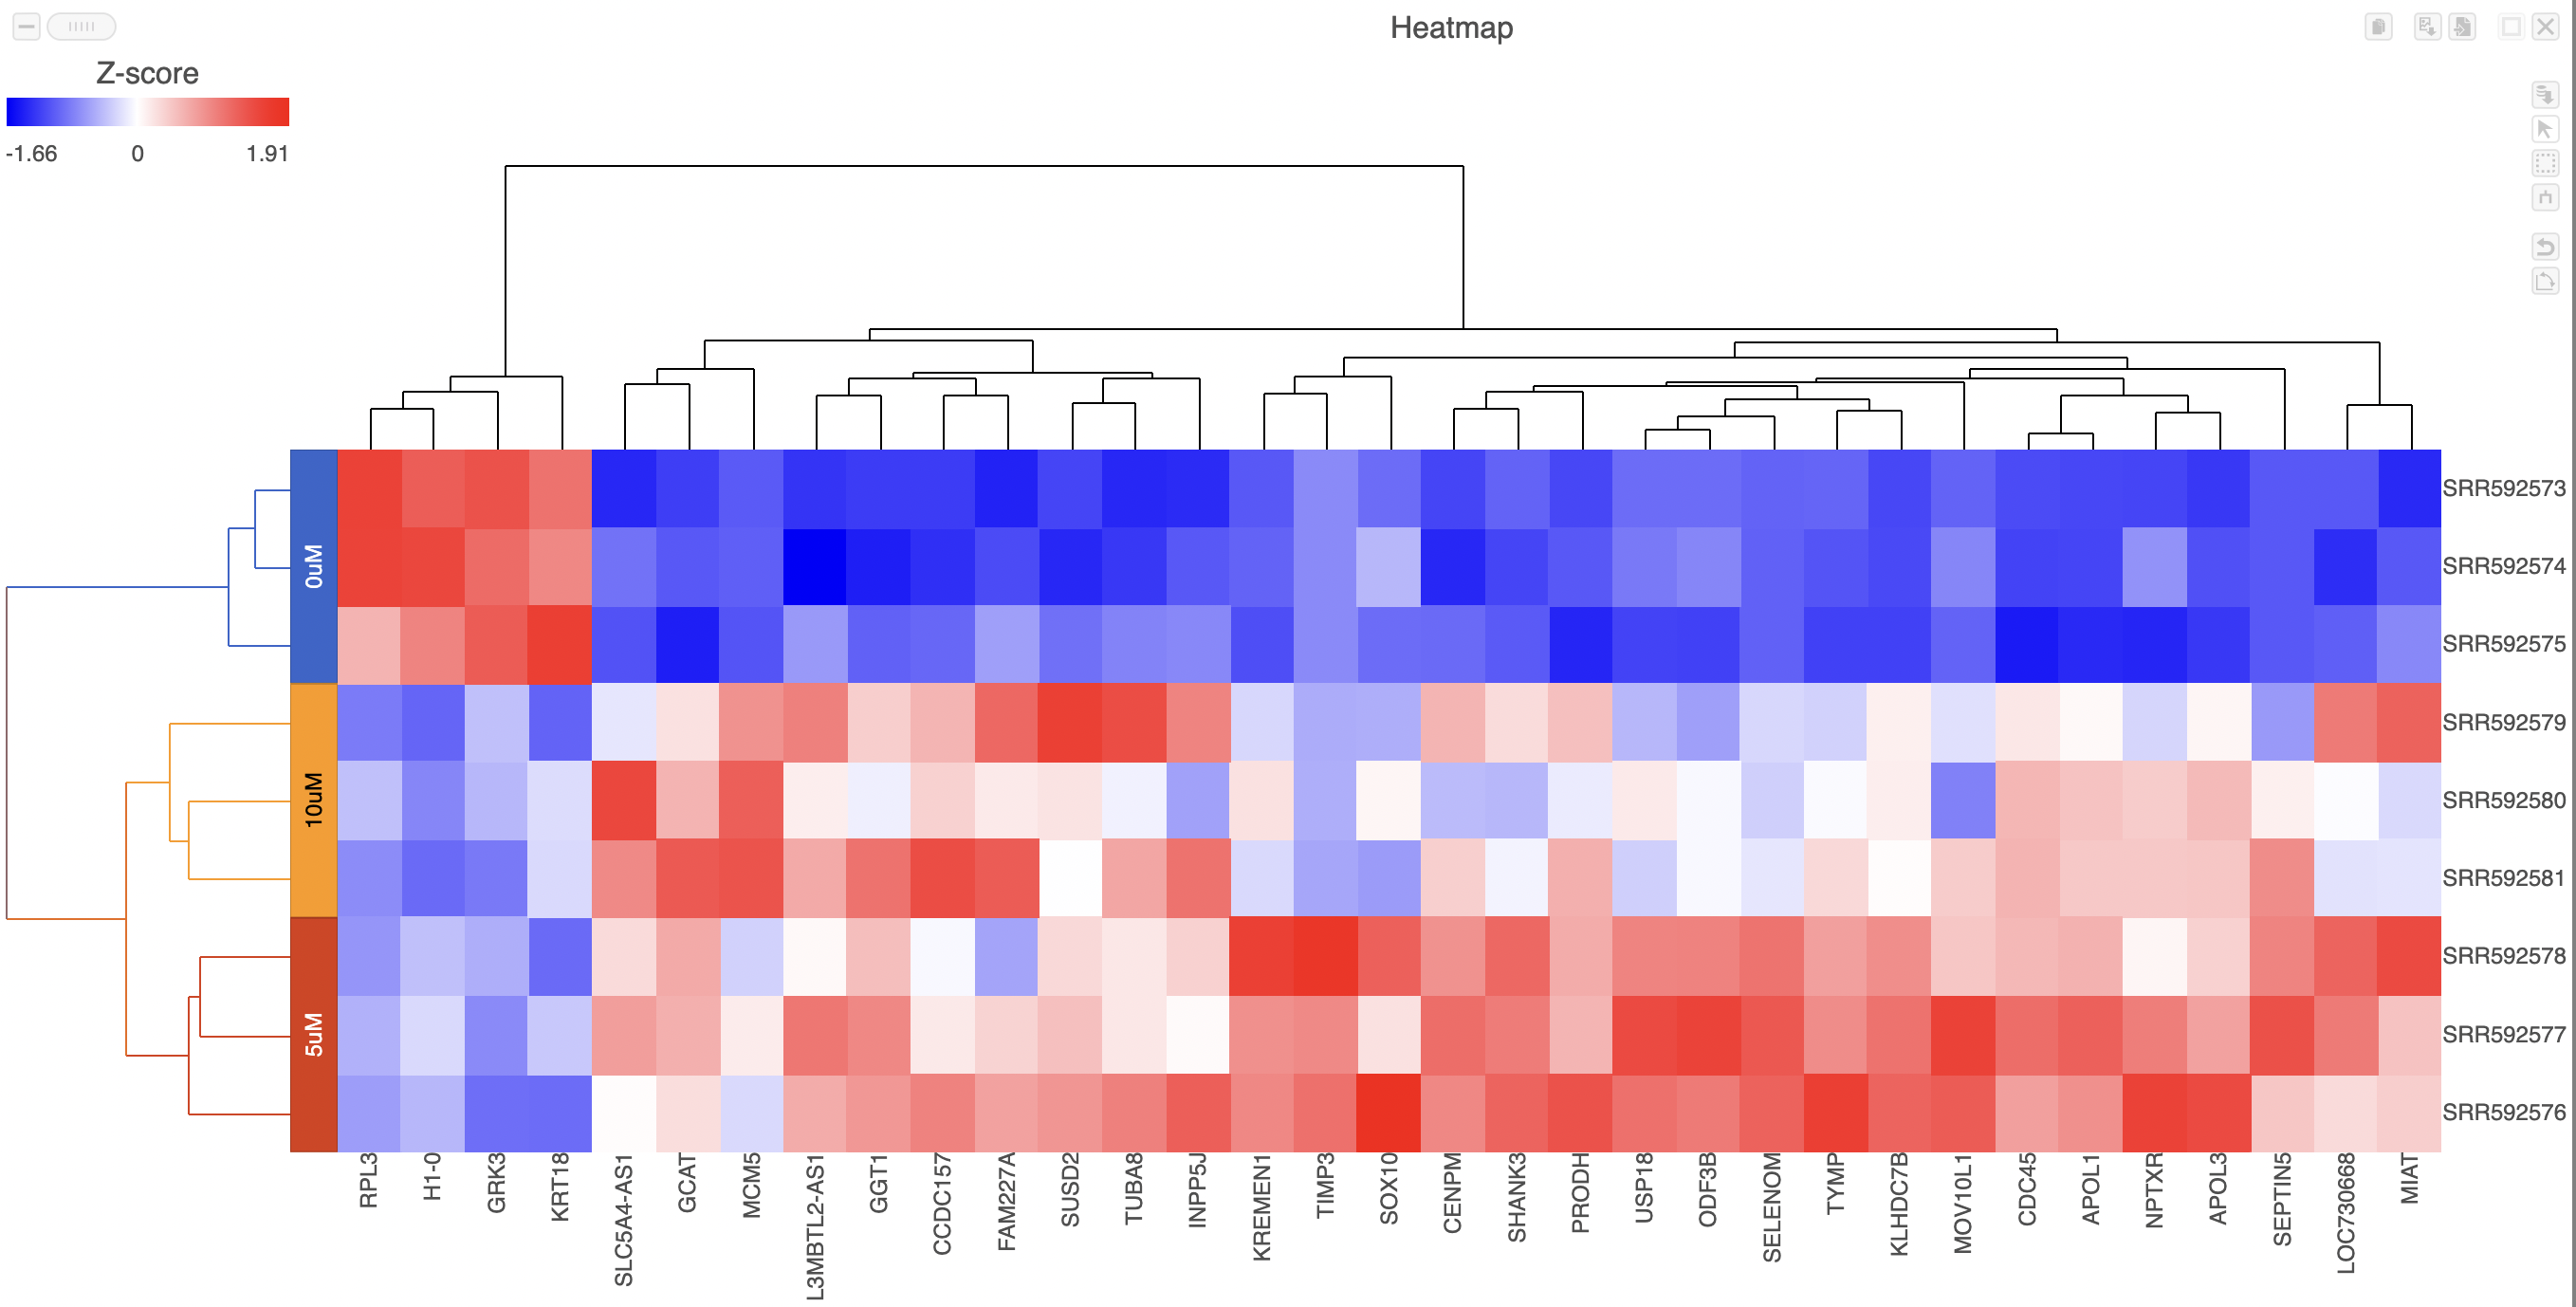
The heatmap can be customized to improve data visualization using the menu on the Configuration panel on the left. You can select Annotations to choose the appropriate attribute to annotate the rows, as well as coloring the dendogram using the Dendogram Dendograms menu. The color palette used to viusalize gene expression can be modified by accessing the Heatmap menu menu on the left and selecting the colors to be used from the sliding bar (Figure 4). (Figure 2).
...
| Numbered figure captions | ||||
|---|---|---|---|---|
| ||||
   |
...
| Numbered figure captions | ||||
|---|---|---|---|---|
| ||||
|
ghjkl
Click the Save image button ![]() to save a PNG or SVG image to your computer.
to save a PNG or SVG image to your computer.
Click the Send to notebook button ![]() to send the image to a page in the Notebook.
to send the image to a page in the Notebook.
ghjkl
ghjkl
ghjkl
| Additional assistance |
|---|
Overview
Content Tools