Page History
| Table of Contents | ||||||
|---|---|---|---|---|---|---|
|
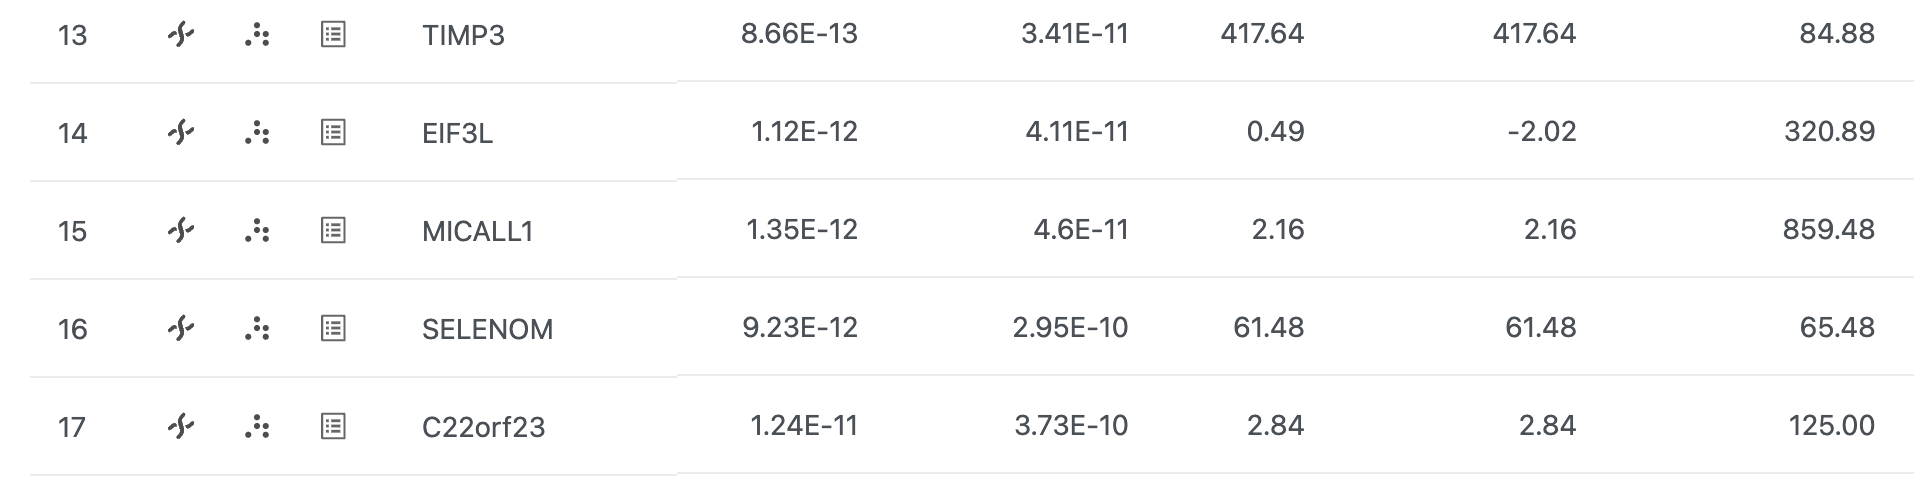
From the GSA the DESeq2 task report, we can browse to any gene in the Chromosome Viewview.
- Select Click
 in the SELM SELENOM row to open Chromosome View view (Figure 1)
| Numbered figure captions | ||||
|---|---|---|---|---|
| ||||
|
A new tab will open showing SELM SELENOM in the Chromosome View view (Figure 2).
| Numbered figure captions | ||||
|---|---|---|---|---|
| ||||
|
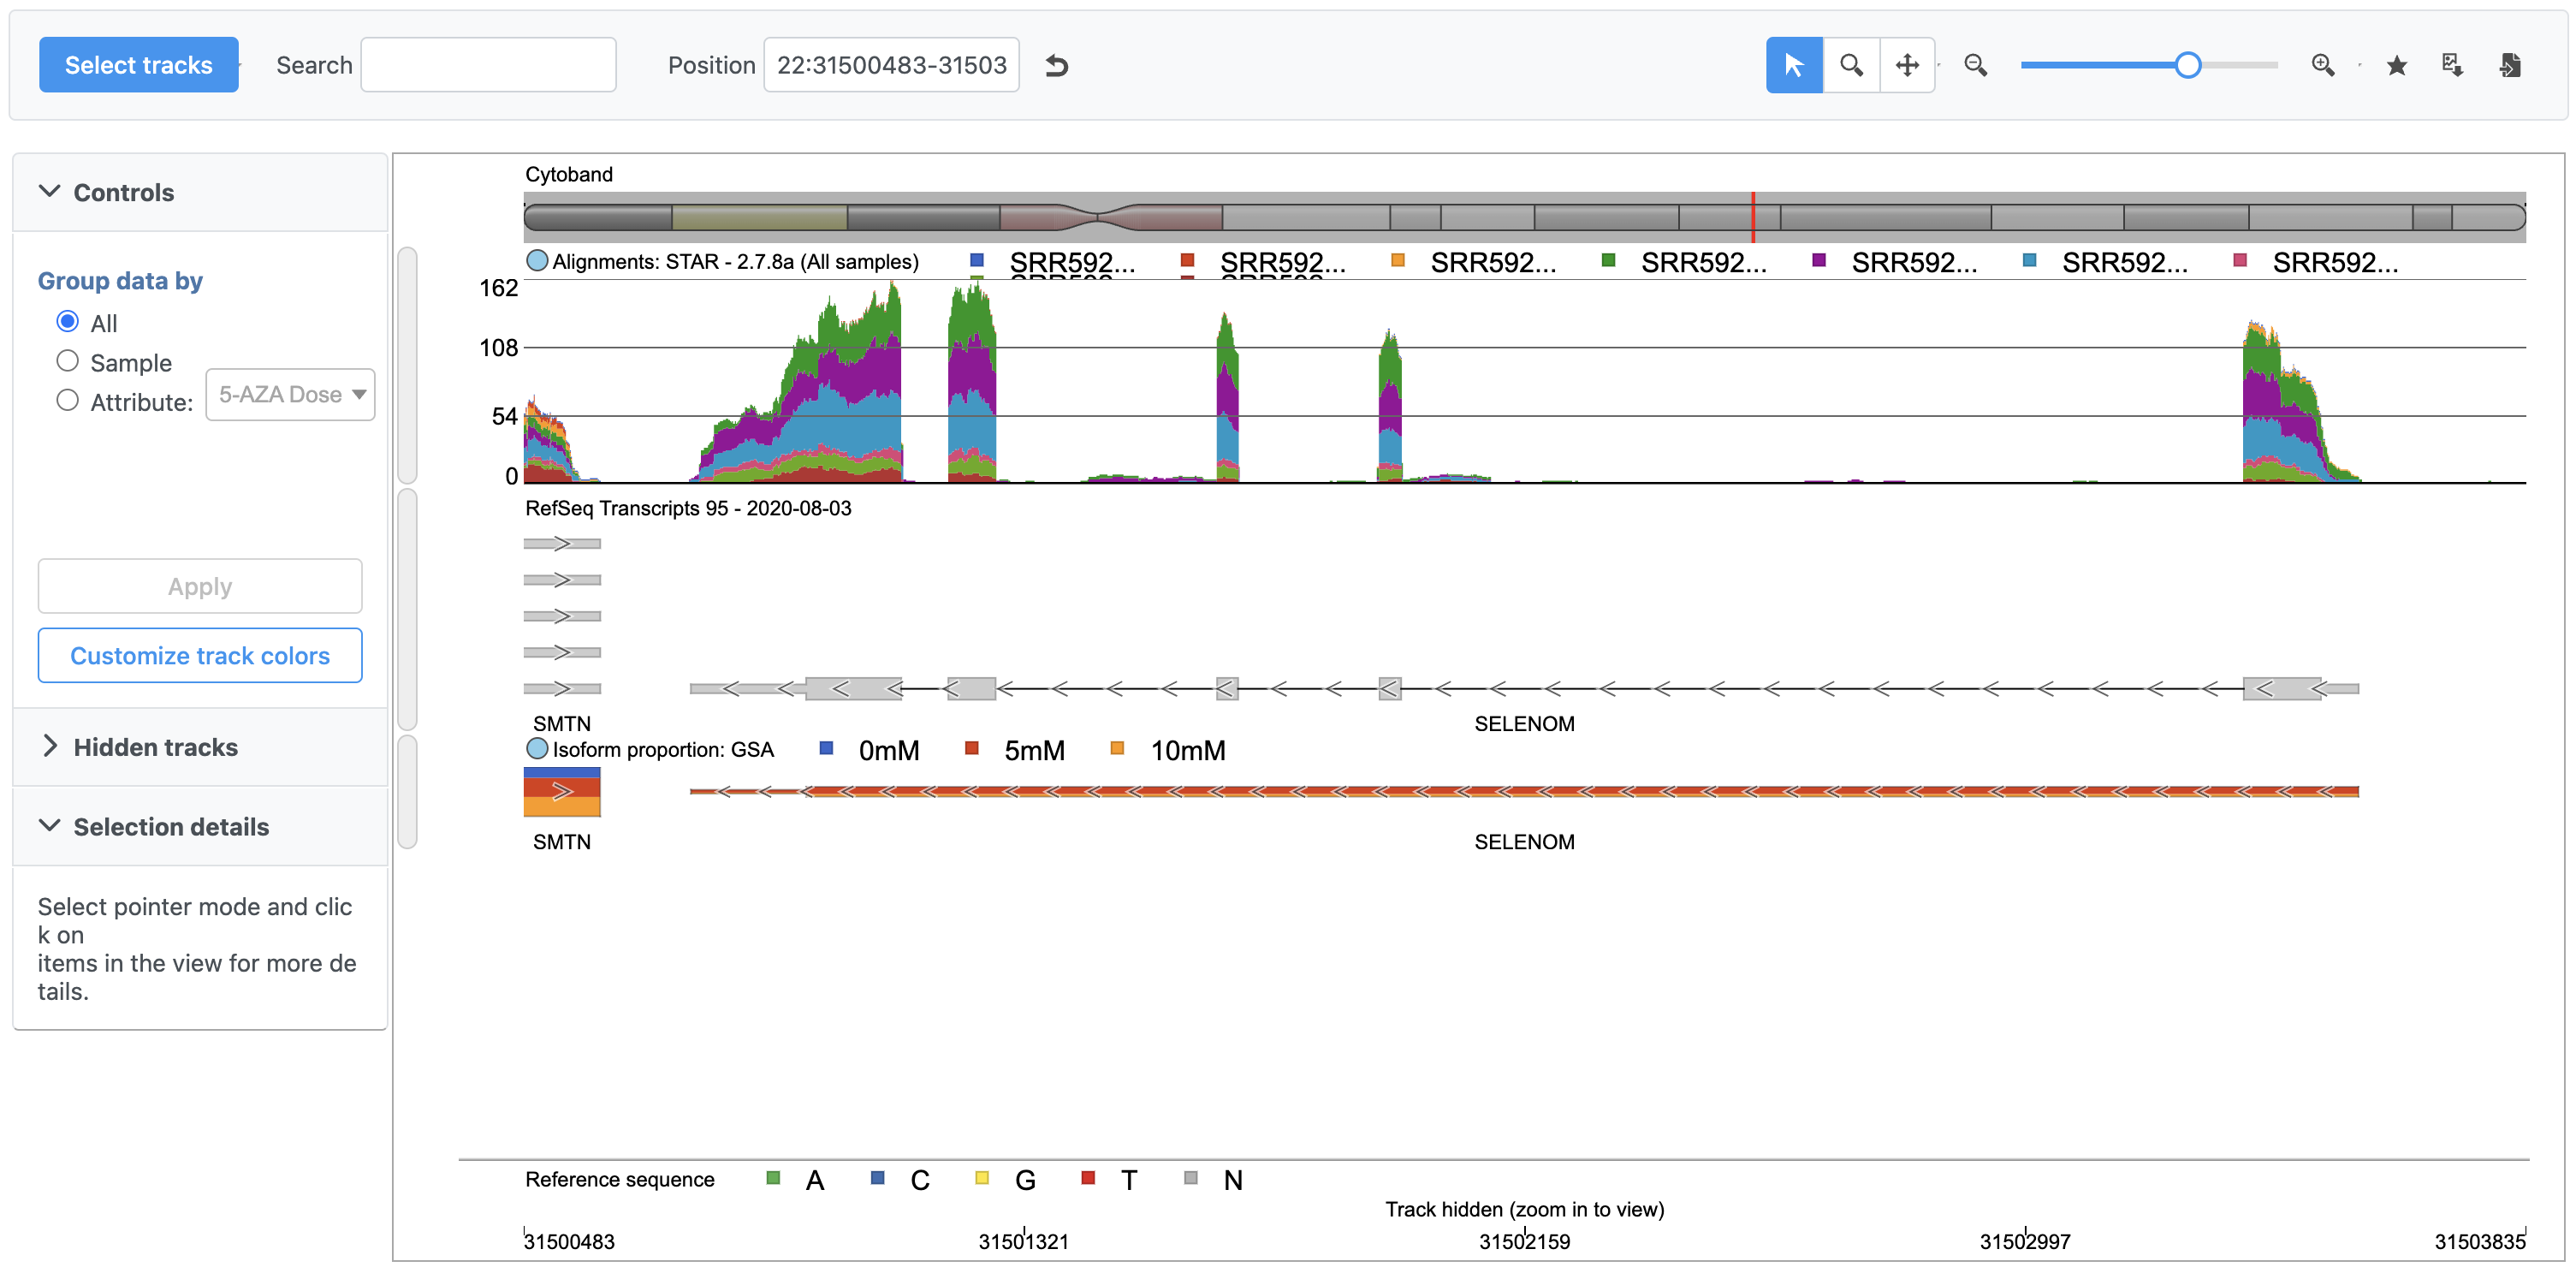
Chromosome View shows reference genome, annotation, and data set information together aligned at genomic coordinates.
Each track has Configure track  and Move track
  buttons that can be used to modify each track.
The top track (Figure prev.) shows average number of total count normalized reads for each of the three treatment groups in a stacked histogram. The second track shows the RefSeq annotation.
We can add tracks from any data node using Select Tracks.
- Click Select Select tracks
A pop-up dialog showing the pipeline allows us to choose which data to display as tracks in Chromosome Viewview (Figure 3).
...
| Numbered figure captions | ||||
|---|---|---|---|---|
| ||||
|

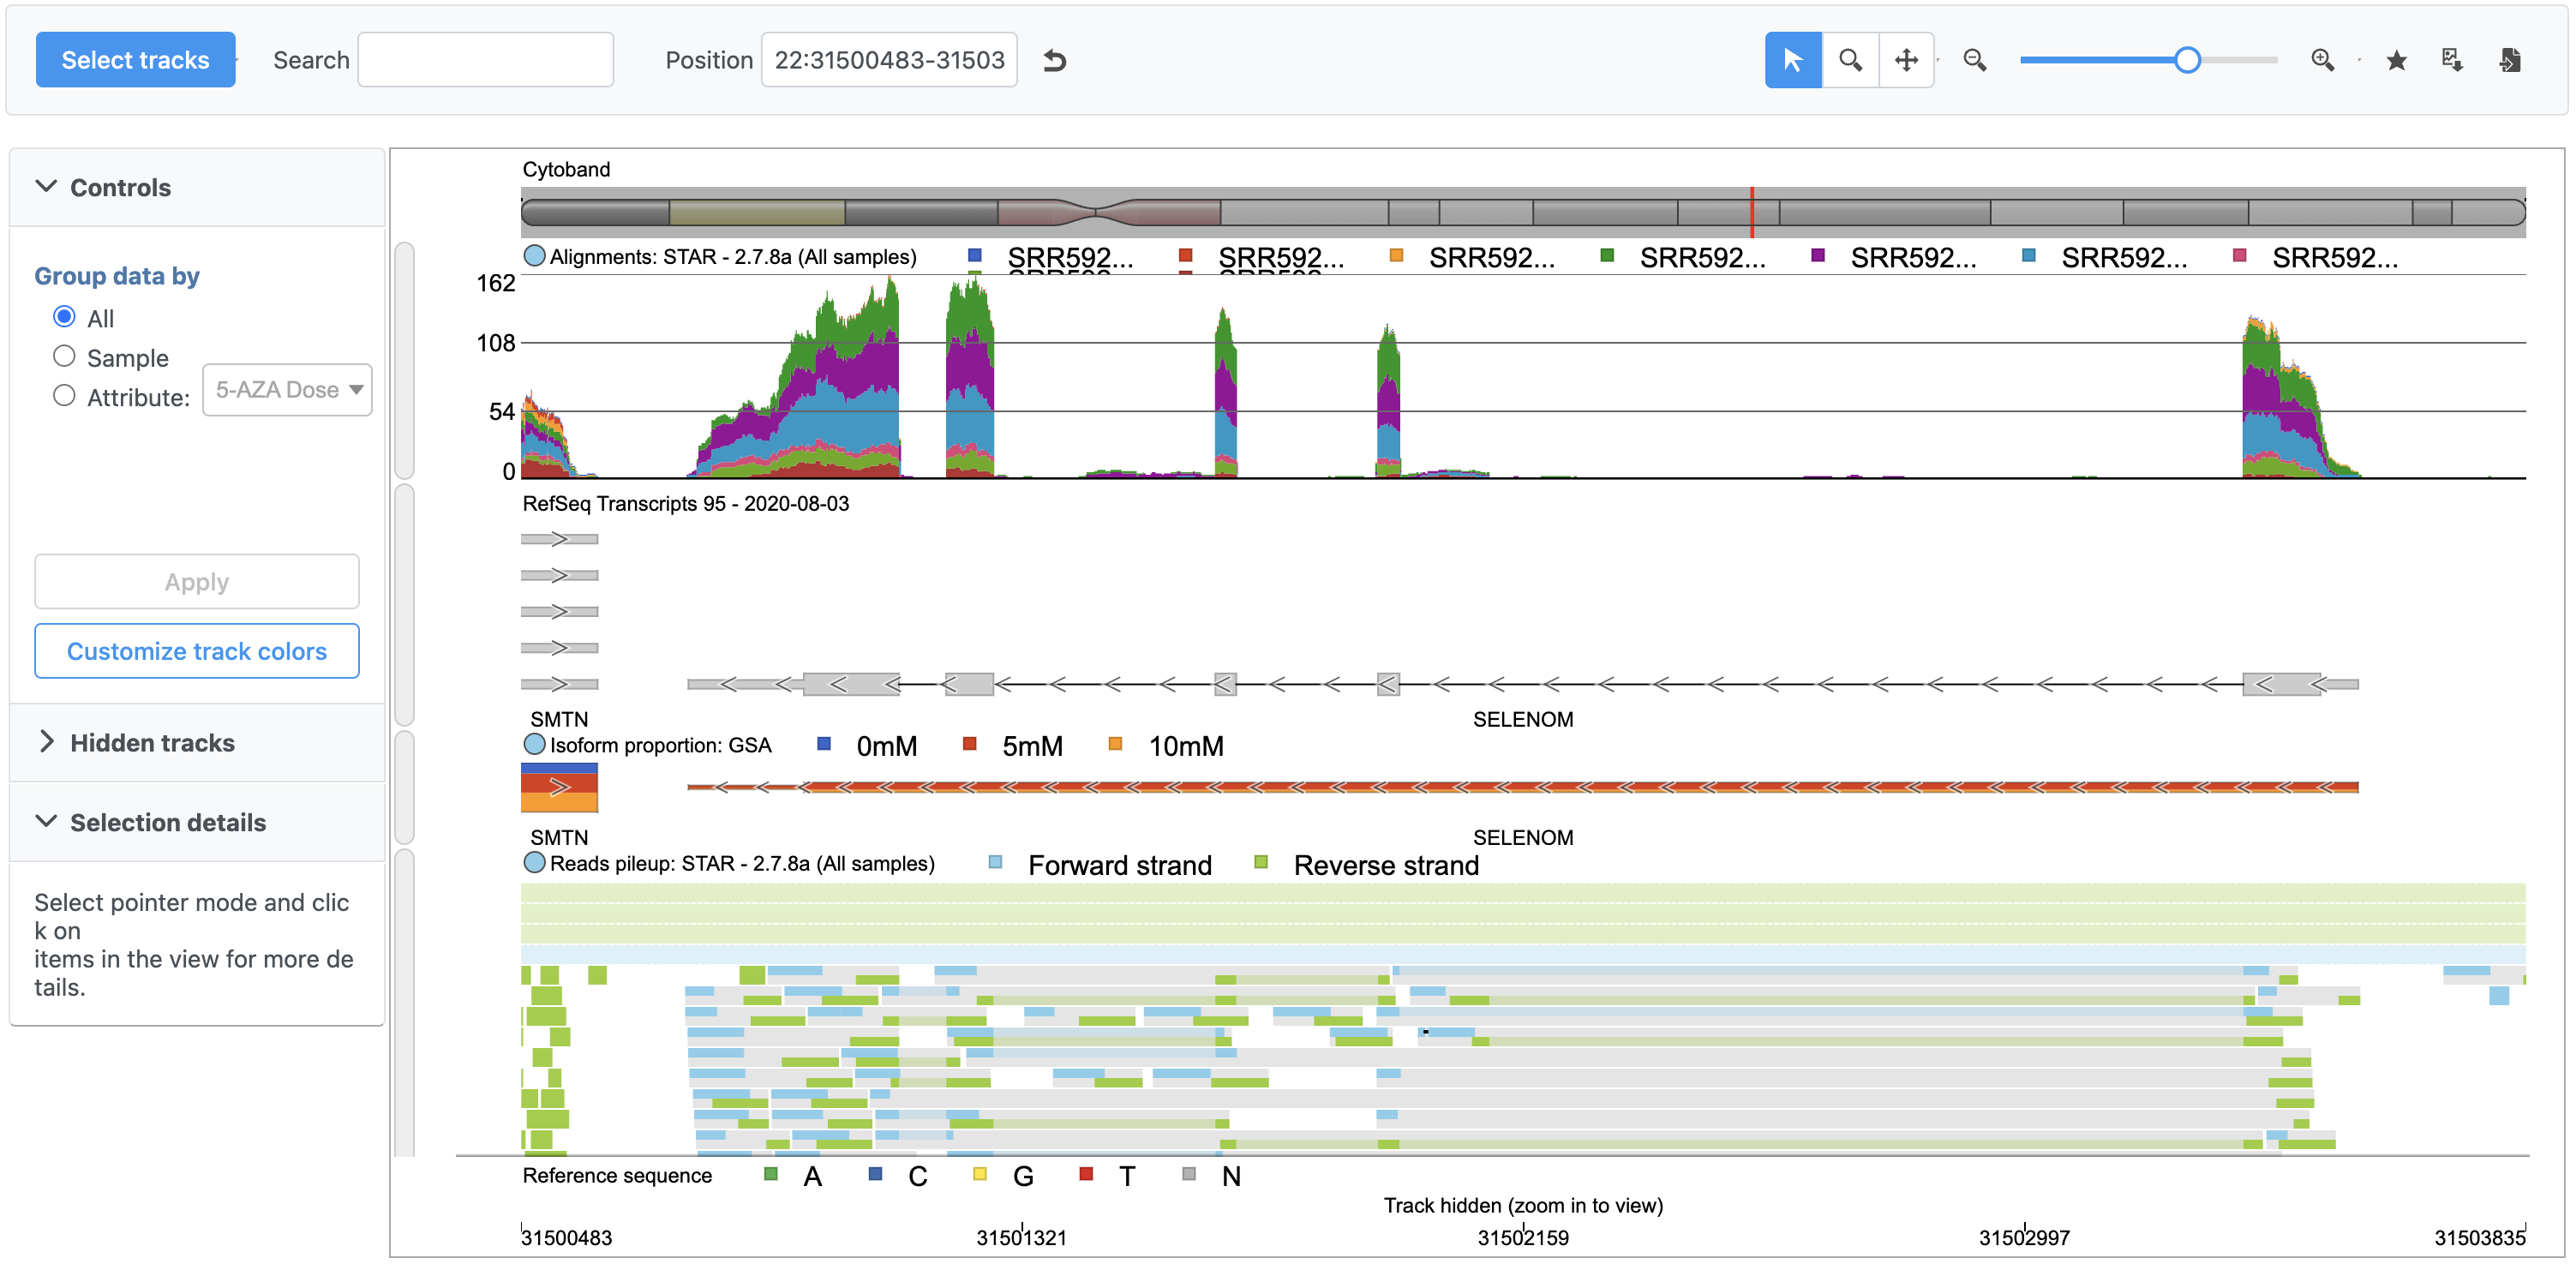
- Click Reads pileup under Align Aligned reads on the left-hand side of the dialog
- Select Click Display tracks to make the change
The reads pileup track is now included (Figure 4).
Selecting a read brings up detailed information about the read in the selection details panel (Figure).
| Numbered figure captions | ||||
|---|---|---|---|---|
| ||||
|
To learn more about Chromosome Viewview, please consult the Chromosome View user guide.
| Page Turner | ||
|---|---|---|
|
| Additional assistance |
|---|
| Rate Macro | ||
|---|---|---|
|
...
Overview
Content Tools