Page History
...
- Select p-value_filtered from the spreadsheet tree
- Select Find nearest genomic features Nearest Genomic Feature from the Peak Analysis section of the ChIP-Seq workflow
The Output Overlapping Features dialog will open (Figure 1).
| Numbered figure captions | ||||
|---|---|---|---|---|
| ||||
|
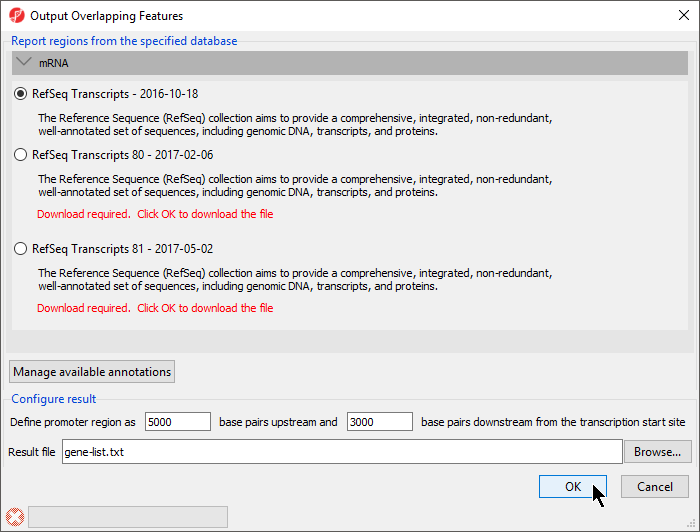
With this dialog, you can specify the reference database. Here
- Select RefSeq Transcripts 81 -
...
- 2017-
...
- 08-02 or your preferred annotation database
The promoter region can also be defined. The default settings are appropriate in this case.
- Select OK
The resulting spreadsheet, gene-list, is a child of the p-value_filtered spreadsheet (Figure 2). Each row represents a transcript.
| Numbered figure captions | ||||
|---|---|---|---|---|
| ||||
|
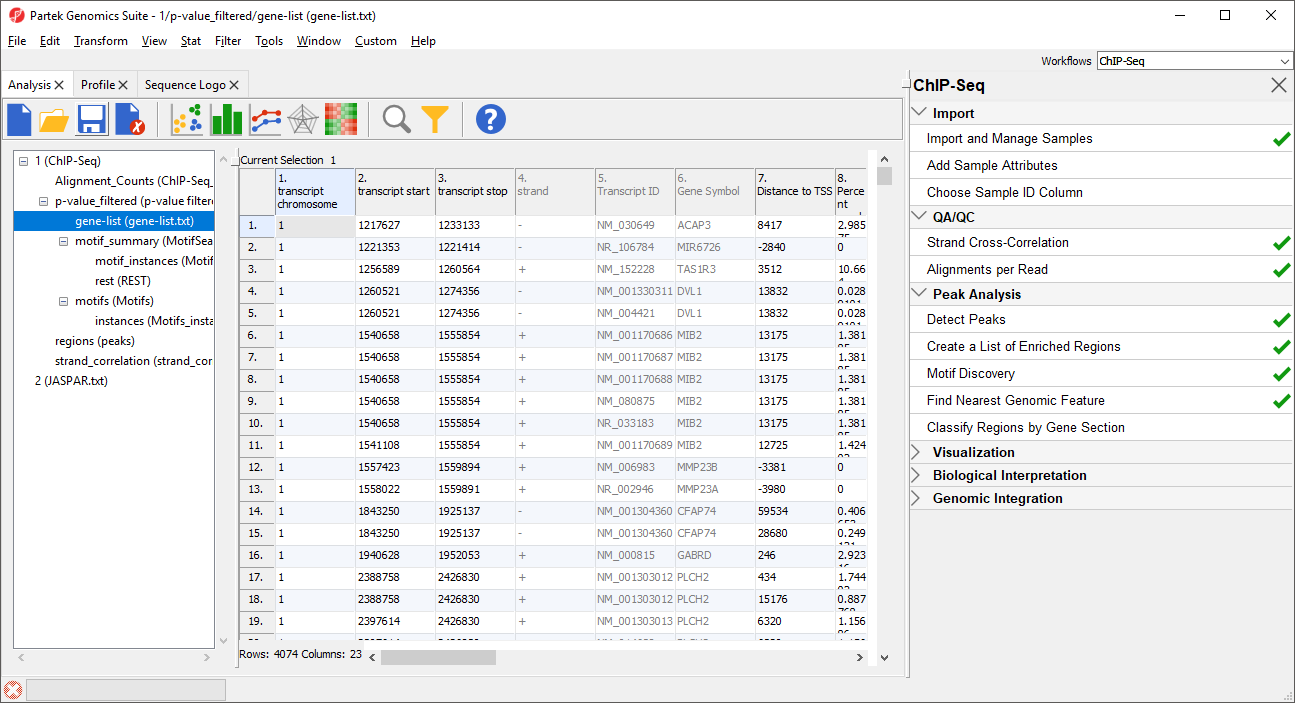
Column 1. transcript chromosome gives the chromosome location of transcript
...
Column 7. Distance to TSS gives the distance of each enriched region to the transcription start site in base pairs with positive indicates indicating downstream and negative indicates indicating upstream
Column 8. Percent overlap with gene gives the percent of the gene that overlaps with the region
...
- Select p-value_filtered from the spreadsheet tree
- Select Classify regions by gene selection from the Peak Analysis section of the ChIP-Seq workflow
The Output Overlapping Features dialog will open.
- Select RefSeq Transcripts 81 - 2017-08-02 or your preferred annotation database
The promoter region can also be defined. The default settings are appropriate in this case. The results can be further configured to give one result per detected region or one result per genomic feature. The default setting, one result per detected region, is appropriate in this case.
- Select OK
A new spreadsheet, gene-classification will be generated (Figure 3).
| Numbered figure captions | ||||
|---|---|---|---|---|
| ||||
|
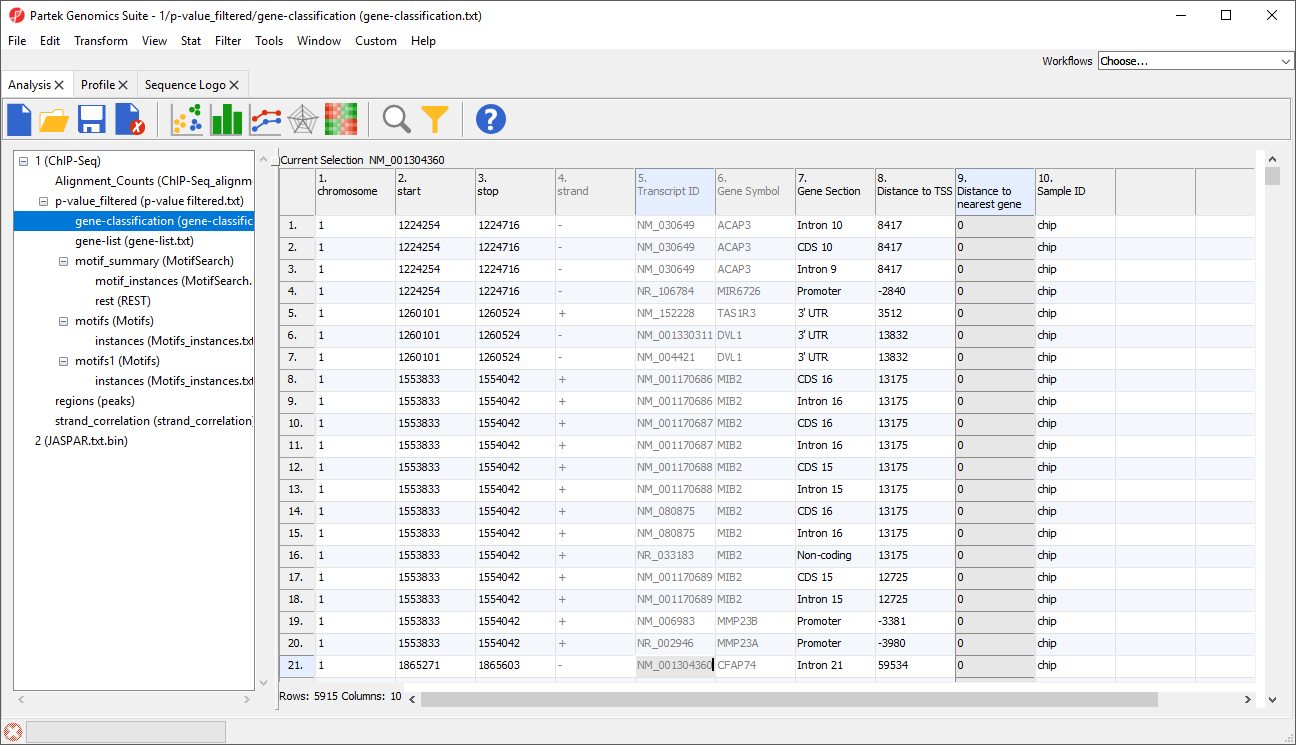
Columns 1-6 have the same contents we saw in gene-list.
Column 7. Gene Section gives the section of the gene that overlaps with the region
Column 8. Distance to TSS gives the distance of each enriched region to the transcription start site in base pairs with positive indicates downstream and negative indicating upstream
Column 9. Distance to nearest gene gives the distance of each enriched region to the nearest gene in base pairs with positive indicating downstream and negative indicating upstream
Column 10. Sample ID gives the sample in which the region is enriched
| Page Turner | ||
|---|---|---|
|
| Additional assistance |
|---|
|
| Rate Macro | ||
|---|---|---|
|
Overview
Content Tools