Page History
| Table of Contents | ||||||
|---|---|---|---|---|---|---|
|
...
Feature many-to-one correlation
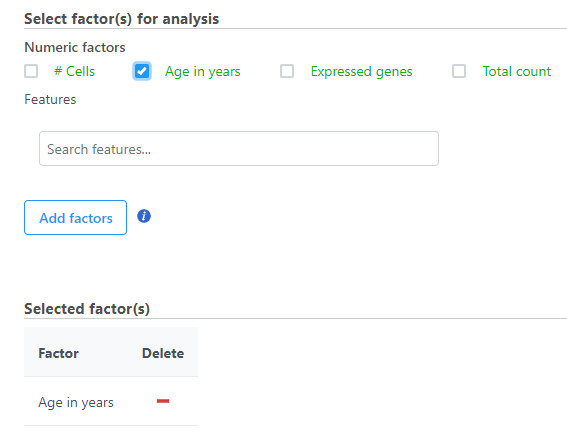
Only numeric factors are available. When multiple numeric factors are added, the correlation analysis will perform each factor with a feature in the data node independently. If you are interested in particular features, use the Search features box to add one or more.
- Select the factors and interactions to include in the statistical test (Figure 2).
| Numbered figure captions | ||||
|---|---|---|---|---|
| ||||
|
...
Correlation analysis produces a Correlation data node; double-click to open the task report (Figure 3) which is similar to the ANOVA/LIMMA-trend/LIMMA-voom and GSA task reports and includes a table with features on rows and statistical results on columns.
...
abs(Correlation coefficient): magnitude of correlation select a cutoff for reporting the absolute value of the correlation coefficient (represented by the symbol r) ; the greater the absolute value the stronger the correlation
A perfect linear relationship yields a correlation coefficient of +1 (or -1 for a negative relationship) and no linear relationship yields a correlation coefficient of 0.
- Compute the absolute value of the correlation coefficient between two variables
where a perfect relationship is 1 and no relationship is 0
Correlation across assays produces a Correlation pair list data node; double-click to open the table (Figure 5). The table can be sorted and filtered using the column titles.
...
Overview
Content Tools