Page History
...
| Numbered figure captions | ||||
|---|---|---|---|---|
| ||||
|
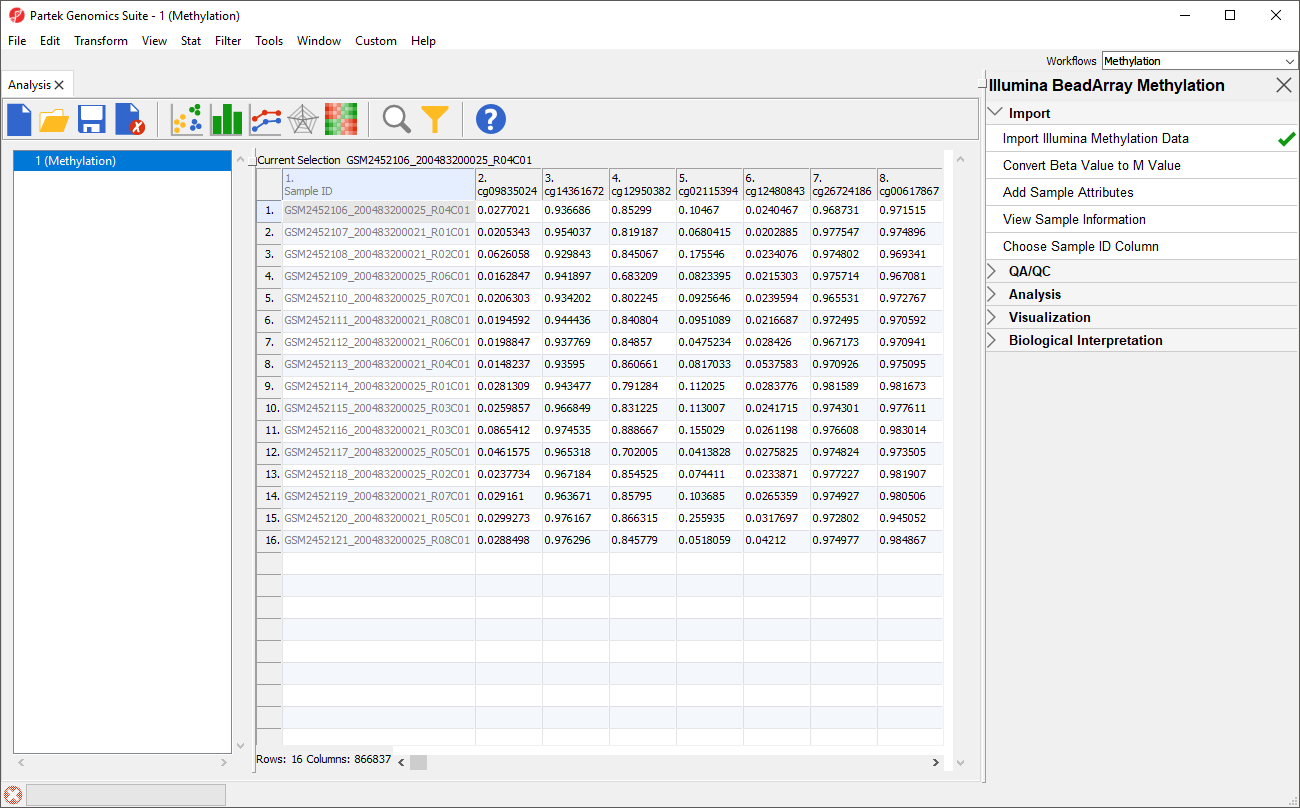
An alternative metric for measurement of methlyation levels are M-values. β-values can be easily converted to M-values using the following equation:
M-value = log2( β / (1 - β))
An M-value close to 0 for a CpG site indicates a similar intensity between the methylated and unmethylated probes, which means the CpG site is about half-methylated. Positive M-values mean that more molecules are methylated than unmethylated, while negative M-values mean that more molecules are unmethylated than methylated. As discussed by Du and colleagues, the β-value has a more intuitive biological interpretation, but the M-value is more statistically valid for the differential analysis of methylation levels.
Because we are performing differential methylation analysis, we need to convert our data to from β-values to M-values.
- Select Convert Beta Value to M Value from the Import section of the Illumina BeadArray Methylation workflow
The original data (β-values) will be overwritten.
- Select (
 ) from the icon bar to save the current spreadsheet
|
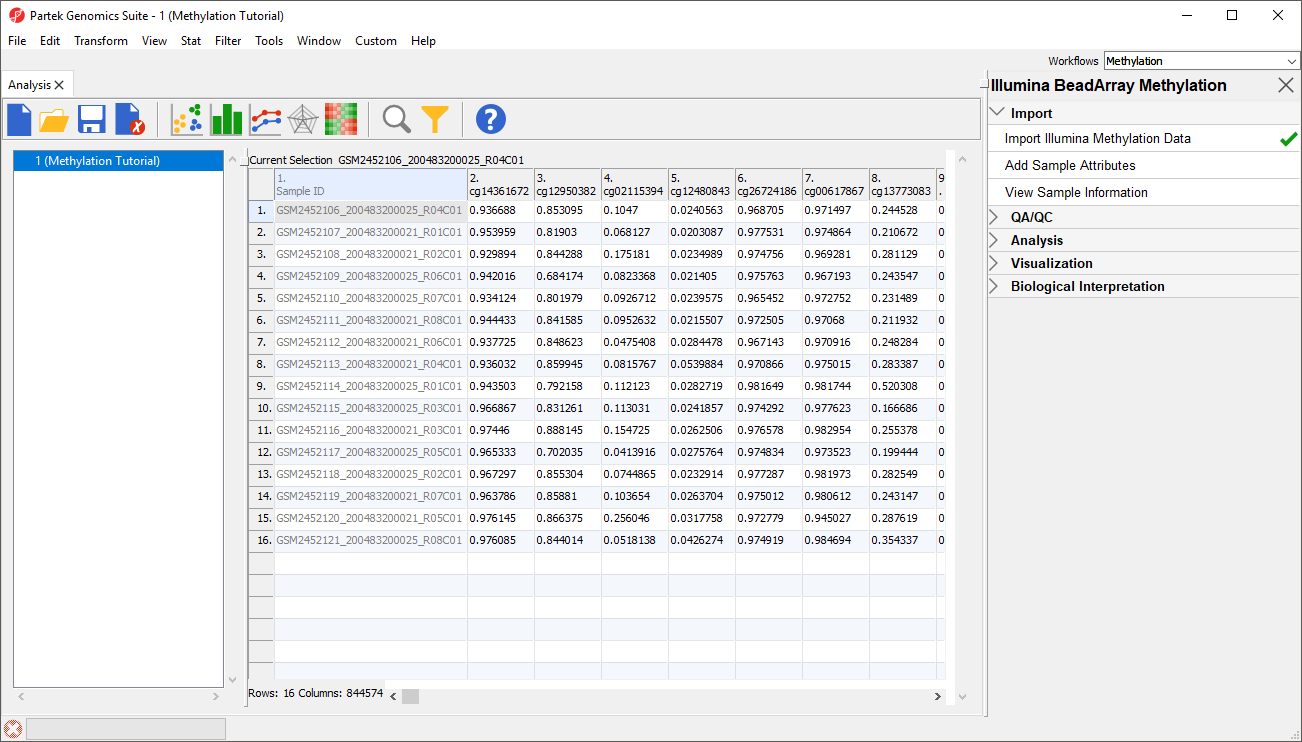
Before we can perform any analysis, the study samples need to be organized into their experimental groups.
...
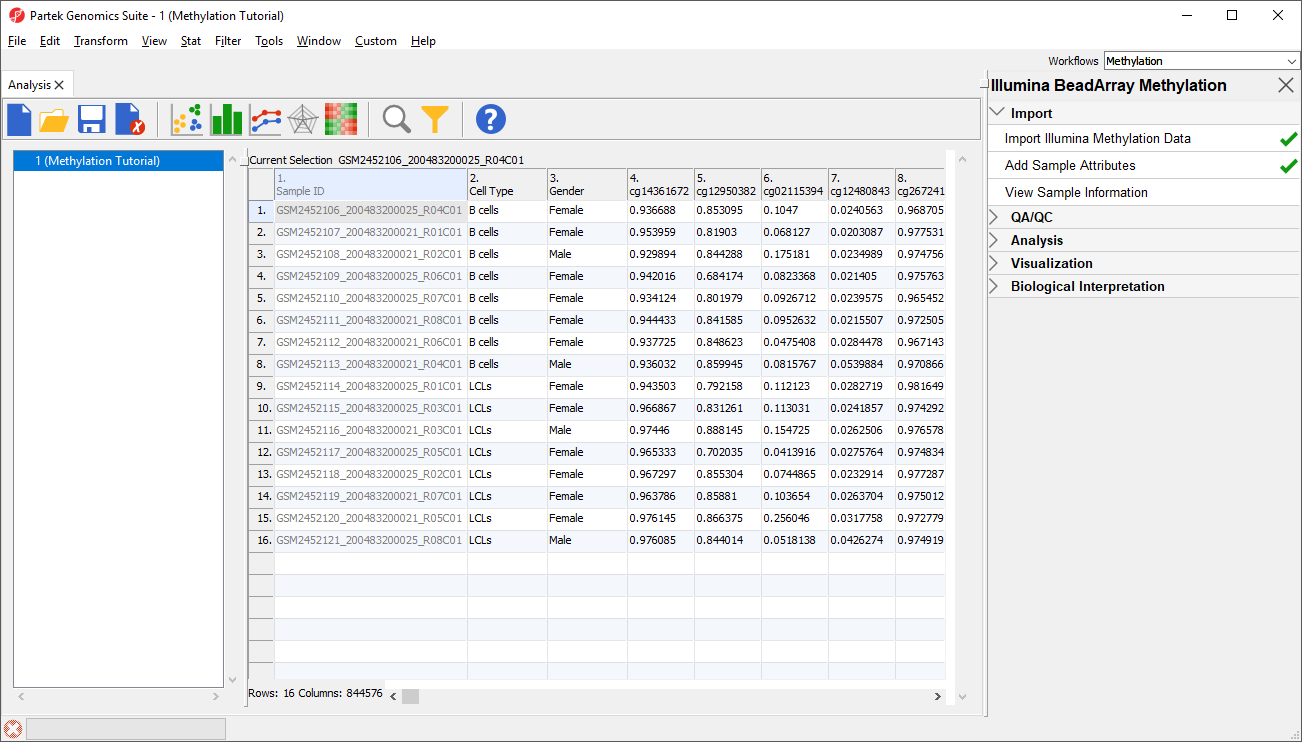
Two new columns have been added to spreadsheet 1 (Methylation) with the cell type and gender of each sample (Figure 5). For this tutorial, we want to exclude all male samples to simplify our analysis. To do this, we can use the interactive filter.
| Numbered figure captions | |
|---|---|
|
...
|
...
| |
|
| Page Turner | ||
|---|---|---|
|
...
Overview
Content Tools