Page History
...
| Numbered figure captions | ||||
|---|---|---|---|---|
| ||||
|
An alternative metric for measurement of methlyation levels are M-values. β-values can be easily converted to M-values using the following equation:
M-value = log2( β / (1 - β))
An M-value close to 0 for a CpG site indicates a similar intensity between the methylated and unmethylated probes, which means the CpG site is about half-methylated. Positive M-values mean that more molecules are methylated than unmethylated, while negative M-values mean that more molecules are unmethylated than methylated. As discussed by Du and colleagues, the β-value has a more intuitive biological interpretation, but the M-value is more statistically valid for the differential analysis of methylation levels.
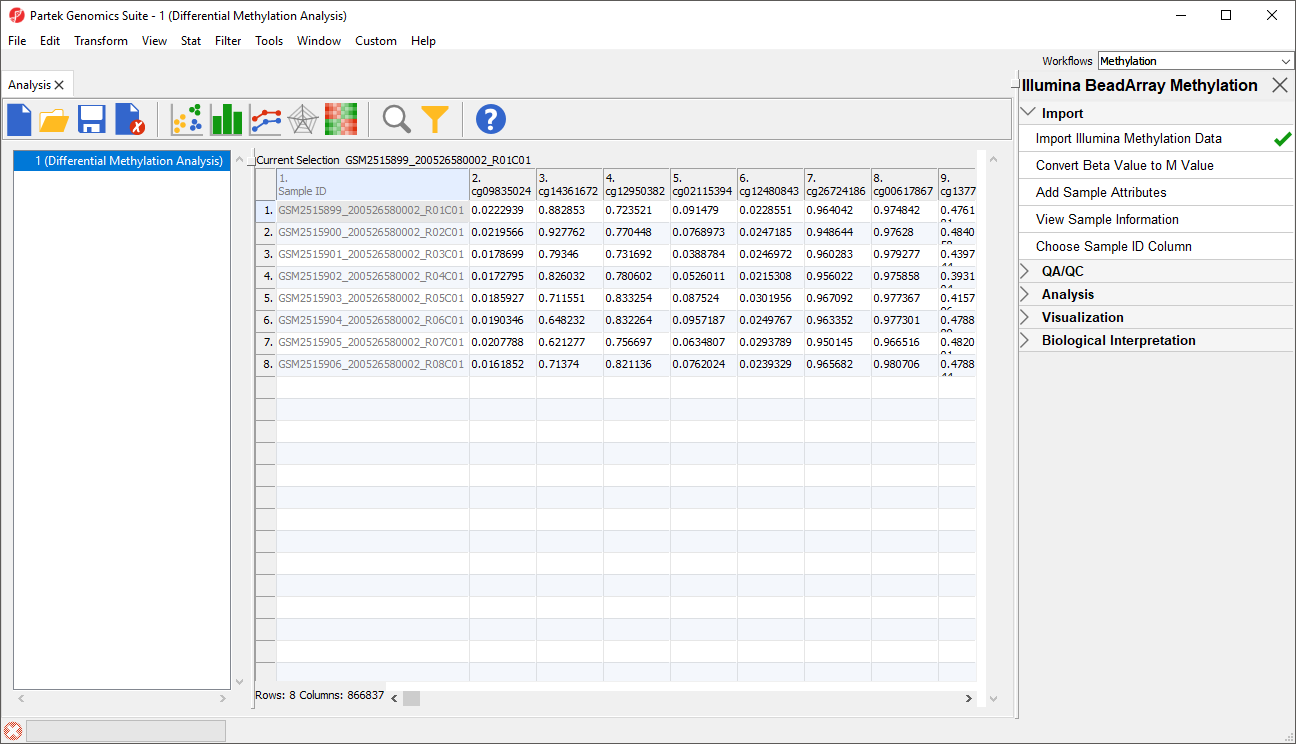
Because we are performing differential methylation analysis, we need to convert our data to from β-values to M-values.
- Select Convert Beta Value to M Value from the Import section of the Illumina BeadArray Methylation workflow
The original data (β-values) will be overwritten.
- Select (
 ) from the icon bar to save the current spreadsheet
|
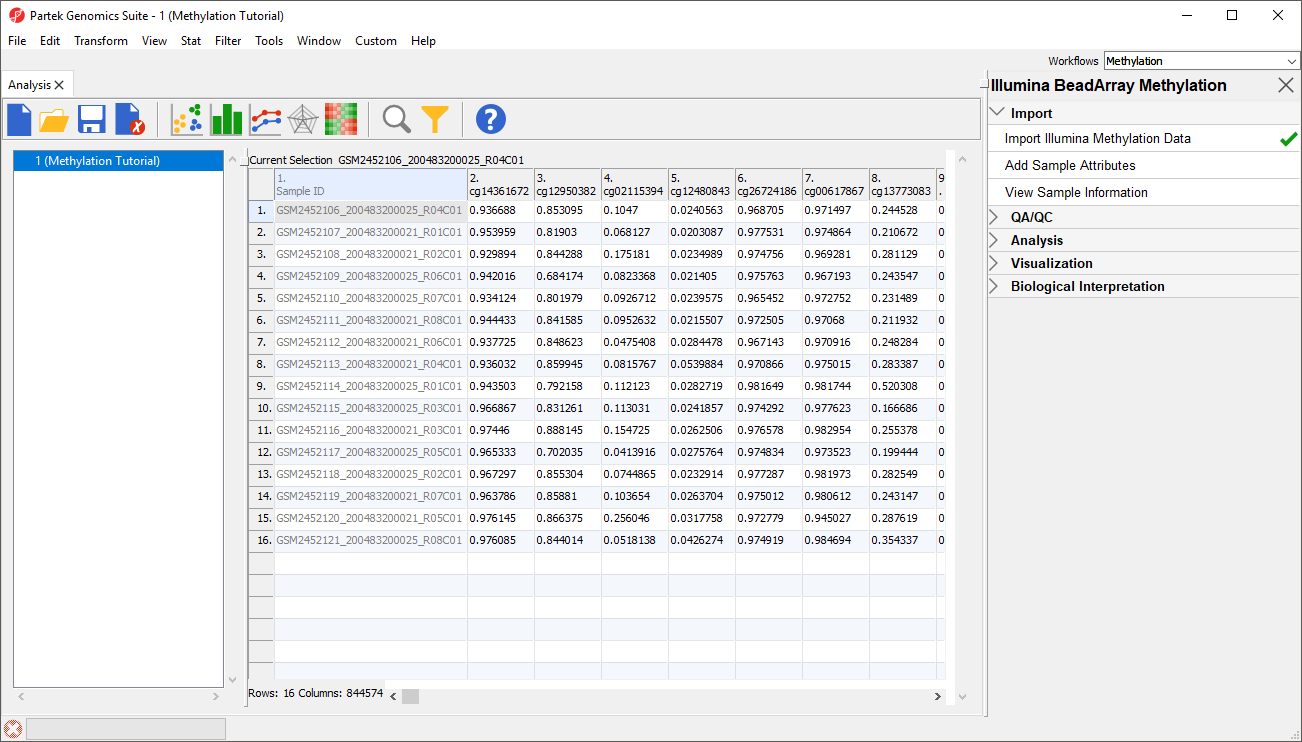
Before we can perform any analysis, the study samples need to be organized into their experimental groups.
...
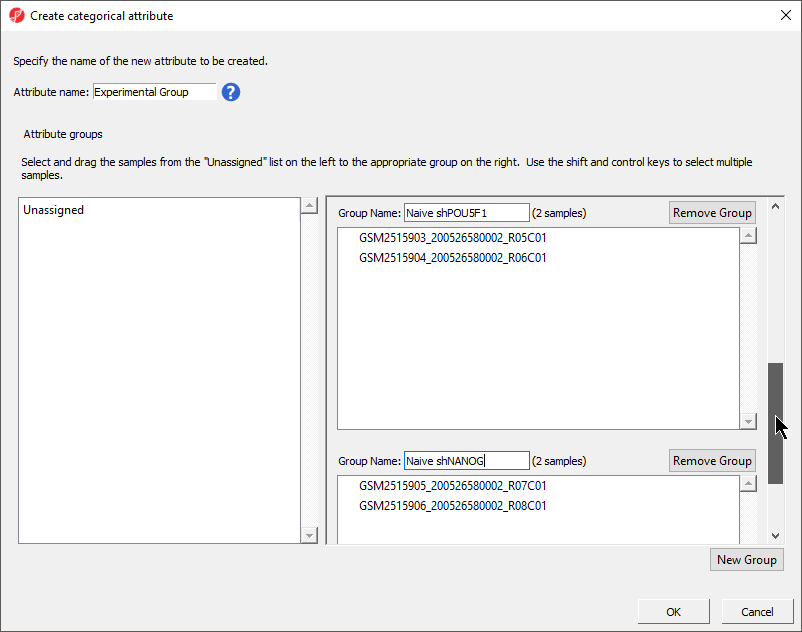
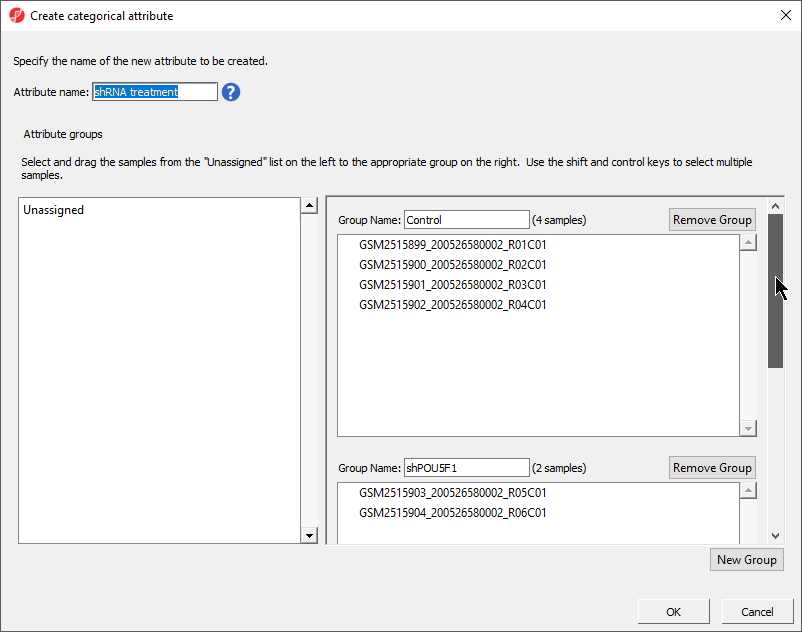
The Create categorical attribute dialog allows us to create groups for a categorical attribute. By default, two groups are created, but additional groups can be added.
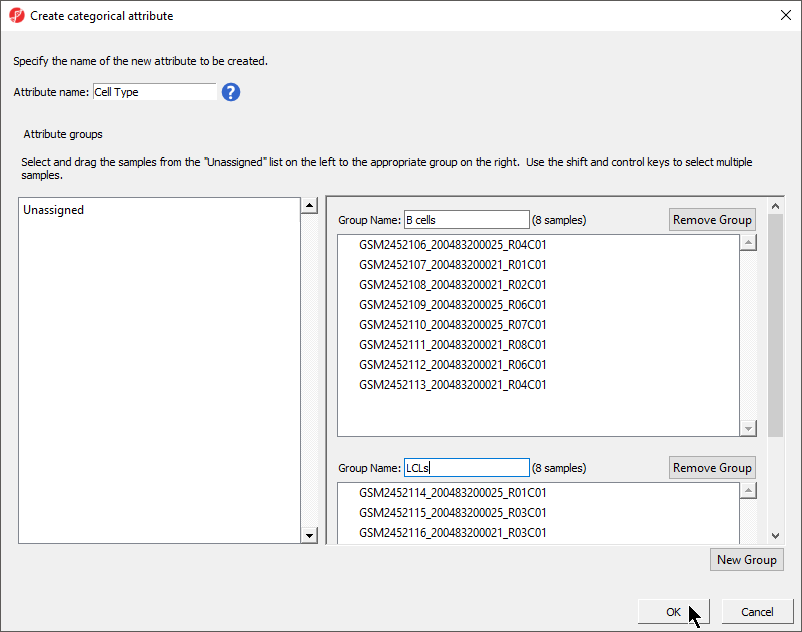
- Set Attribute name: to StateCell Type
- Rename the groups Primed and Naivegroups B cells and LCLs
- Drag and drop the samples from the Unassigned list to their groups as listed in the table below
| Sample ID | Group NameCell Type | |
|---|---|---|
| GSM2515899GSM2452106_200526580002_200483200025_R04C01 | B cells | |
| GSM2452107_200483200021_R01C01 | PrimedB cells | |
| GSM2515900GSM2452108_200526580002200483200021_R02C01 | PrimedB cells | |
| GSM2515901GSM2452109_200526580002200483200025_R03C01R06C01 | NaiveB cells | |
| GSM2515902GSM2452110_200526580002_R04C01 | Naive | |
| GSM2515903_200526580002_R05C01 | Naive | |
| GSM2515904_200526580002_R06C01 | Naive | |
| GSM2515905_200526580002_R07C01 | Naive | |
| GSM2515906_200526580002_R08C01 | Naive200483200025_R07C01 | B cells |
| GSM2452111_200483200021_R08C01 | B cells | |
| GSM2452112_200483200021_R06C01 | B cells | |
| GSM2452113_200483200021_R04C01 | B cells | |
| GSM2452114_200483200025_R01C01 | LCLs | |
| GSM2452115_200483200025_R03C01 | LCLs | |
| GSM2452116_200483200021_R03C01 | LCLs | |
| GSM2452117_200483200025_R05C01 | LCLs | |
| GSM2452118_200483200025_R02C01 | LCLs | |
| GSM2452119_200483200021_R07C01 | LCLs | |
| GSM2452120_200483200021_R05C01 | LCLs | |
| GSM2452121_200483200025_R08C01 | LCLs |
There should now be two groups with eight samples in each group (Figure 43).
| Numbered figure captions | ||||
|---|---|---|---|---|
| ||||
|
- Select OK
- Select Yes from the Add another categorical attribute dialog
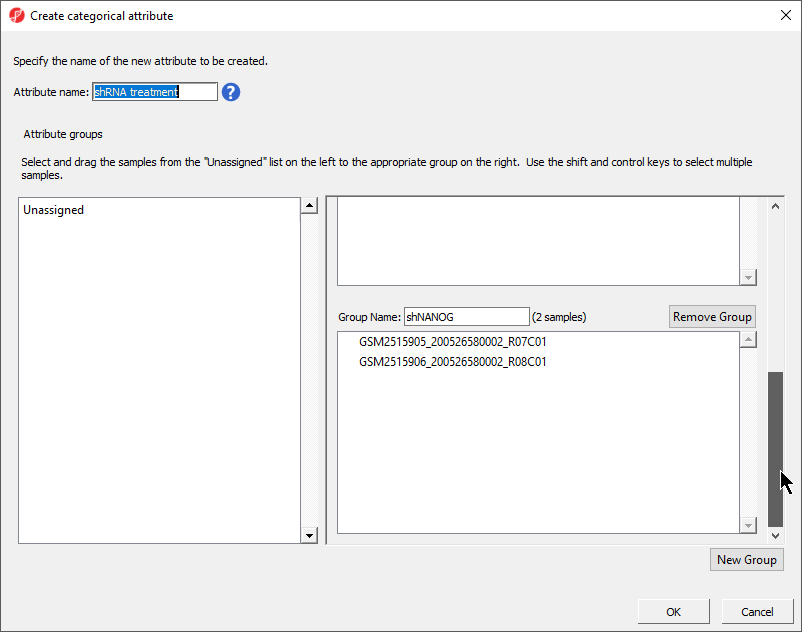
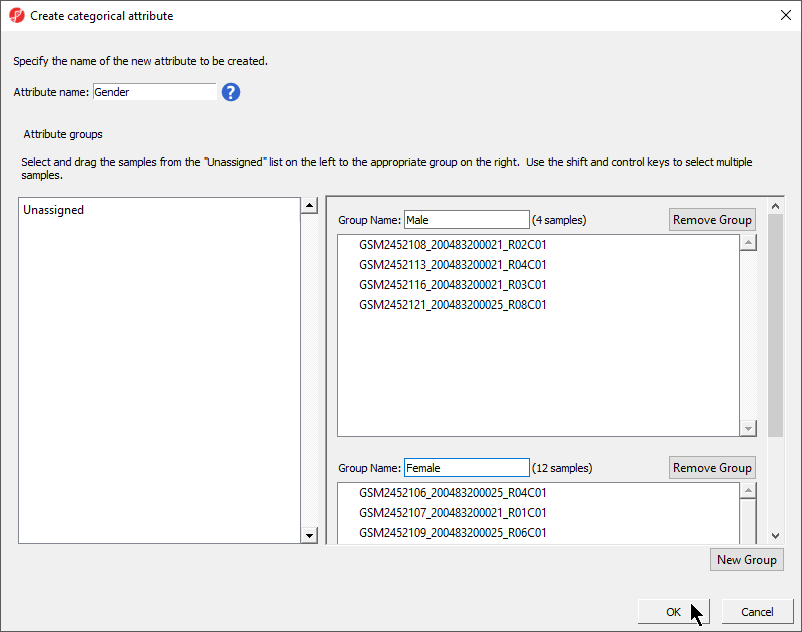
- Set Set Attribute name: to shRNA treatmentSelect New Group to add an additional groupto Gender
- Rename the three groups Control, shPOU5F1, and shNANOGgroups Male and Female
- Drag and drop the samples from the Unassigned list to their groups as listed in the table below
| Sample ID | Group NameGender | ||
|---|---|---|---|
| GSM2452106_ | 200526580002_200483200025_R04C01 | Female | |
| GSM2452107_200483200021_R01C01 | ControlFemale | ||
| GSM2452108_ | 200526580002200483200021_R02C01 | ControlMale | GSM2515901|
| GSM2452109_ | 200526580002200483200025_ | R03C01R06C01 | ControlFemale |
| GSM2515902GSM2452110_200526580002_R04C01 | Control | ||
GSM2515903_200526580002_R05C01 | shPOU5F1 | ||
GSM2515904_200526580002_R06C01 | shPOU5F1 | ||
GSM2515905_200526580002_R07C01 | shNANOG | ||
GSM2515906_200526580002_R08C01 | shNANOG200483200025_R07C01 | Female | |
| GSM2452111_200483200021_R08C01 | Female | ||
| GSM2452112_200483200021_R06C01 | Female | ||
| GSM2452113_200483200021_R04C01 | Male | ||
| GSM2452114_200483200025_R01C01 | Female | ||
| GSM2452115_200483200025_R03C01 | Female | ||
| GSM2452116_200483200021_R03C01 | Male | ||
| GSM2452117_200483200025_R05C01 | Female | ||
| GSM2452118_200483200025_R02C01 | Female | ||
| GSM2452119_200483200021_R07C01 | Female | ||
| GSM2452120_200483200021_R05C01 | Female | ||
| GSM2452121_200483200025_R08C01 | Male |
There should now be three two groups with four samples in each group Male and twelve samples in Female (Figure 54).
| Numbered figure captions | ||||||
|---|---|---|---|---|---|---|
|
| |||||
|
- Select OK
- Select Select No from the Add another categorical attribute dialog
- Select Yes to save the spreadsheet
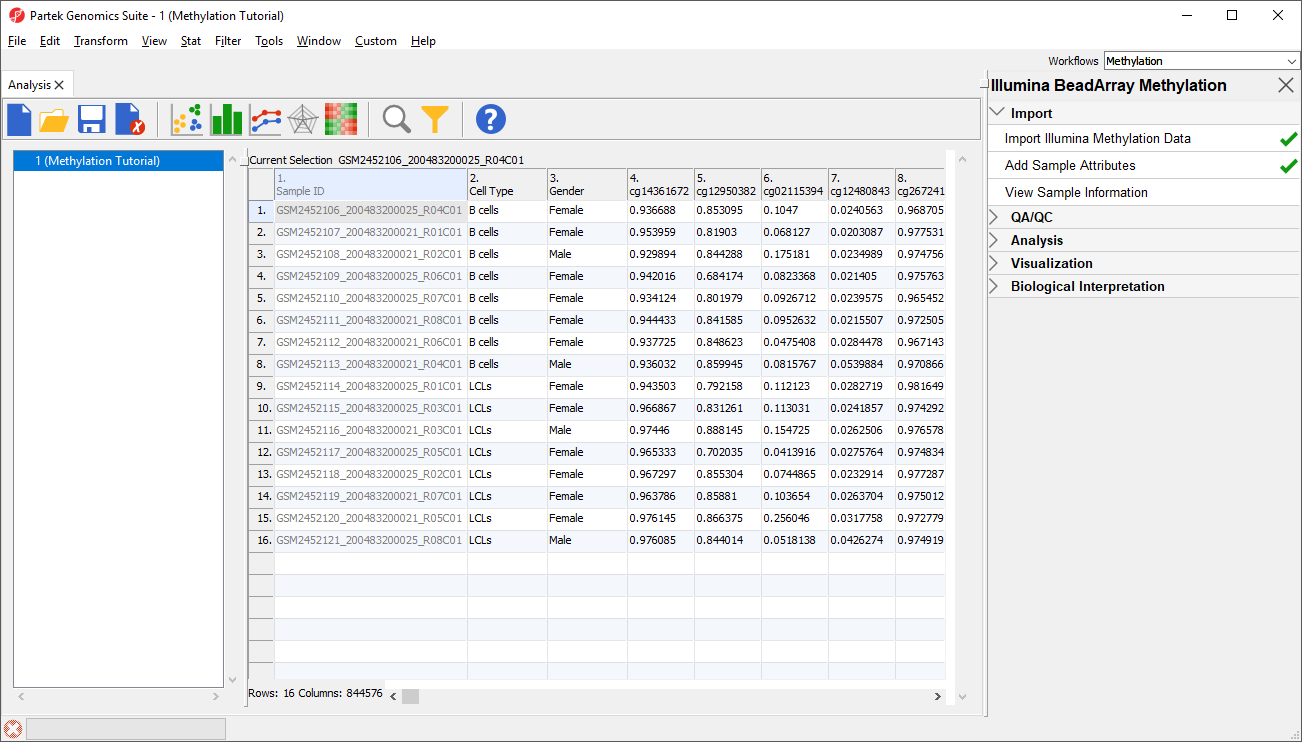
Two new column as columns have been added to spreadsheet 1 (Differential Methylation Analysis) with the state cell type and shRNA treatment gender of each sample (Figure 65).
| Numbered figure captions | |
|---|---|
|
...
|
...
| |
|
| Page Turner | ||
|---|---|---|
|
...
Overview
Content Tools